Revenue is a lagging indicator. By the time it drops, the customers behind it stopped buying weeks or months ago. Retention metrics are the leading indicators: they show customers drifting away while you can still do something about it.
But “track retention” is useless advice without specifics. Below are the five metrics we build for every brand we work with. For each one: what it measures, how to get it out of Shopify or Klaviyo, and how often it’s worth looking at. That last part matters more than most dashboards admit. Some of these numbers move daily. Most don’t.
Key Takeaways
- Most first-time buyers never come back. In Smile.io’s network data, a first-time customer has a 27% chance of ordering again; after a second order, that jumps to 49%.
- Measure repeat rate inside a fixed window based on your own time-to-second-order, and compare cohorts at the same age, not this month against last month.
- Recency and frequency both predict future buying (Fader, Hardie and Lee, 2005). Shopify’s built-in RFM report turns them into segments you can act on.
- Klaviyo’s churn risk and predicted CLV only appear once you have 500+ customers with orders, 180+ days of history, recent orders and some repeat buyers.
- Only automated triggers need daily attention. Review the metrics weekly and make budget calls monthly.
1. Repeat-purchase rate (within a fixed window)
Repeat-purchase rate is the share of customers who place a second order within a set number of days of their first. It’s the most direct answer to “do people come back?”, and for most DTC brands it’s the number that decides whether acquisition ever pays off.
The second order is the hardest one to win. Smile.io’s data covers more than 1.1 billion shoppers across 250,000 e-commerce brands. It shows a 27% chance of returning after a first purchase, 49% after a second and 62% after a third (Smile.io, May 2024). Smile’s merchants all run loyalty programs, so the typical store may sit lower.
How to calculate it:
Repeat-purchase rate = customers from a cohort who placed a 2nd order within W days ÷ customers in that cohort
Pick W from your own data instead of copying a blanket “90 days.” Look at how long your repeat customers took to place their second order, and set the window so it covers most of them. For a consumable it might be 45 days; for furniture it might be a year. In Optimove’s data from more than 3 million fashion and beauty customers, most second purchases happened within the first three months (Optimove, January 2025).
What good looks like: compare yourself with your own history and with similar stores, not with an internet average. Shopify’s analytics include peer benchmarks for retention, with the median, 25th and 75th percentile of stores with similar order volume, market and product categories (Shopify).
For LuxSkin, a skincare client, automated post-purchase and replenishment flows took the repeat-purchase rate from 18% to 34% within 90 days of starting the work (case study). That’s one client’s result, not a typical or guaranteed one, but it shows how much room the second order can have.
The decision it drives: if repeat rate falls, look at what changed for recent customers: the offer they were acquired with, the product they bought first, and the post-purchase emails they got.
2. Cohort retention curves
A cohort retention curve tracks one group of customers, everyone whose first order landed in the same month, and shows how many keep buying as that group ages. It’s the only fair way to compare retention over time, because it compares customers at the same age. Cohort analysis separates “our product is getting better at keeping people” from “we acquired more people this month.”
You don’t need extra tools for this. Shopify’s built-in cohort analysis report groups customers “based on the date that they placed their first order.” It shows retention rate, sales and average order value by week, month or quarter, as a heatmap or a retention curve (Shopify Help Center, Customers reports). You can filter it by first-order channel, product and subscription status.
How to read it:
- Compare columns, not rows. Month 3 for May against month 3 for April tells you whether retention is improving.
- Watch the slope after month 1. A cohort that starts well and flattens fast often means customers bought once on a discount and left. Check the acquisition offer.
- Expect seasonality. For HomeNest, a home decor client, Q4 holiday cohorts followed very different curves from year-round buyers (case study). Compare a December cohort with last December’s, not with October.
The decision it drives: when a newer cohort sits below older ones at the same age, start upstream. Look for a new acquisition channel, a deeper discount or a different hero product. Filter the report by first-order channel and product before blaming the email program.
3. Customer health score (RFM)
A customer health score ranks each customer by how likely they are to buy again. The version we start with uses three inputs: recency, frequency and monetary value (RFM). In our experience, composite scores that mix in email opens and support tickets add noise until the basics work.
The evidence for RFM is strong. Fader, Hardie and Lee modelled 23,570 customers of the online retailer CDNOW and found that “recency and frequency each has a direct and positive association with future purchasing” (Journal of Marketing Research, 2005). Their less obvious finding: a once-frequent buyer who has gone quiet can be worth less than an occasional buyer who ordered recently. The silence itself signals they’ve left.
Shopify ships this as a report. Its RFM customer analysis gives every customer a three-digit score from 1 to 5 on recency, frequency and monetary value. It then sorts them into segments such as Champions, Loyal, Needs attention, At risk, Almost lost and Dormant (Shopify Help Center).
What to track: not an average score, but how many customers sit in each segment and how they move week to week. A growing “At risk” segment is your earliest warning. In our client work, it usually shows up weeks before revenue drops.
The decision it drives: each segment gets its own action. Champions get early access and referrals, not discounts. At-risk and Almost-lost customers get a win-back campaign while they still remember you.
4. Predicted churn risk
Predicted churn risk is the probability that a customer has stopped buying, estimated from their order history. For non-subscription brands there’s no cancel button, so churn has to be inferred from silence that’s gone on longer than expected. That’s what the model does. You don’t need to build it yourself.
Klaviyo calculates it for you. Its predictive analytics add a churn risk score “based on their number and frequency of orders.” It also predicts the date of the next order, average time between orders and customer lifetime value for the next 12 months. The model is retrained “at least once a week” (Klaviyo Help Center, Understanding Klaviyo’s predictive analytics, updated August 2025).
There’s a threshold before you get those fields. Klaviyo requires:
- At least 500 customers who have placed an order
- At least 180 days of order history, with orders in the last 30 days
- Some customers with three or more orders
- An e-commerce integration such as Shopify, or the Klaviyo API
Below that, use a simple rule instead: flag repeat customers who are past 1.5× their own average time between orders. For one-time buyers, flag anyone past your window W from metric 1.
Subscription brands have a cancel button, and the risk clusters early. Recharge found that about 61% of voluntary cancellations happen at the first two renewals, and roughly 72% within the first four (Recharge, 2026). So the first two renewals deserve most of your retention effort.
At FitFuel, a supplement subscription client, 68% of new subscribers churned within 90 days. A churn model flagged at-risk subscribers 14 days before cancellation, and customers acquired with 40%+ discounts churned at 2.3× the rate of full-price buyers (case study). Again, one client’s numbers, but the early-churn pattern matches the Recharge data above.
The decision it drives: connect churn risk to automated flows so a customer moving to high risk gets a timely, relevant message. Then review weekly whether those flows actually bring people back.
5. Revenue at risk
Revenue at risk is the money attached to customers who are likely to churn. It turns a percentage into a dollar figure, which makes retention easy to compare with an ad budget.
How to calculate it:
Revenue at risk = trailing 12-month revenue from customers marked high churn risk (or in At risk and Almost lost RFM segments)
In Klaviyo, build a segment of high churn risk customers and total what they spent in the last 12 months. Their predicted CLV is lower, because the churn risk is already priced in, so the gap between the two shows what’s at stake.
The decision it drives: compare it with what you’d spend to acquire the same revenue. Say $80,000 of annual revenue is at risk. If winning back a quarter of it costs less than acquiring $20,000 of new revenue, retention gets the next dollar. Run it through contribution margin, not revenue, before you decide.
How often should you check each metric?
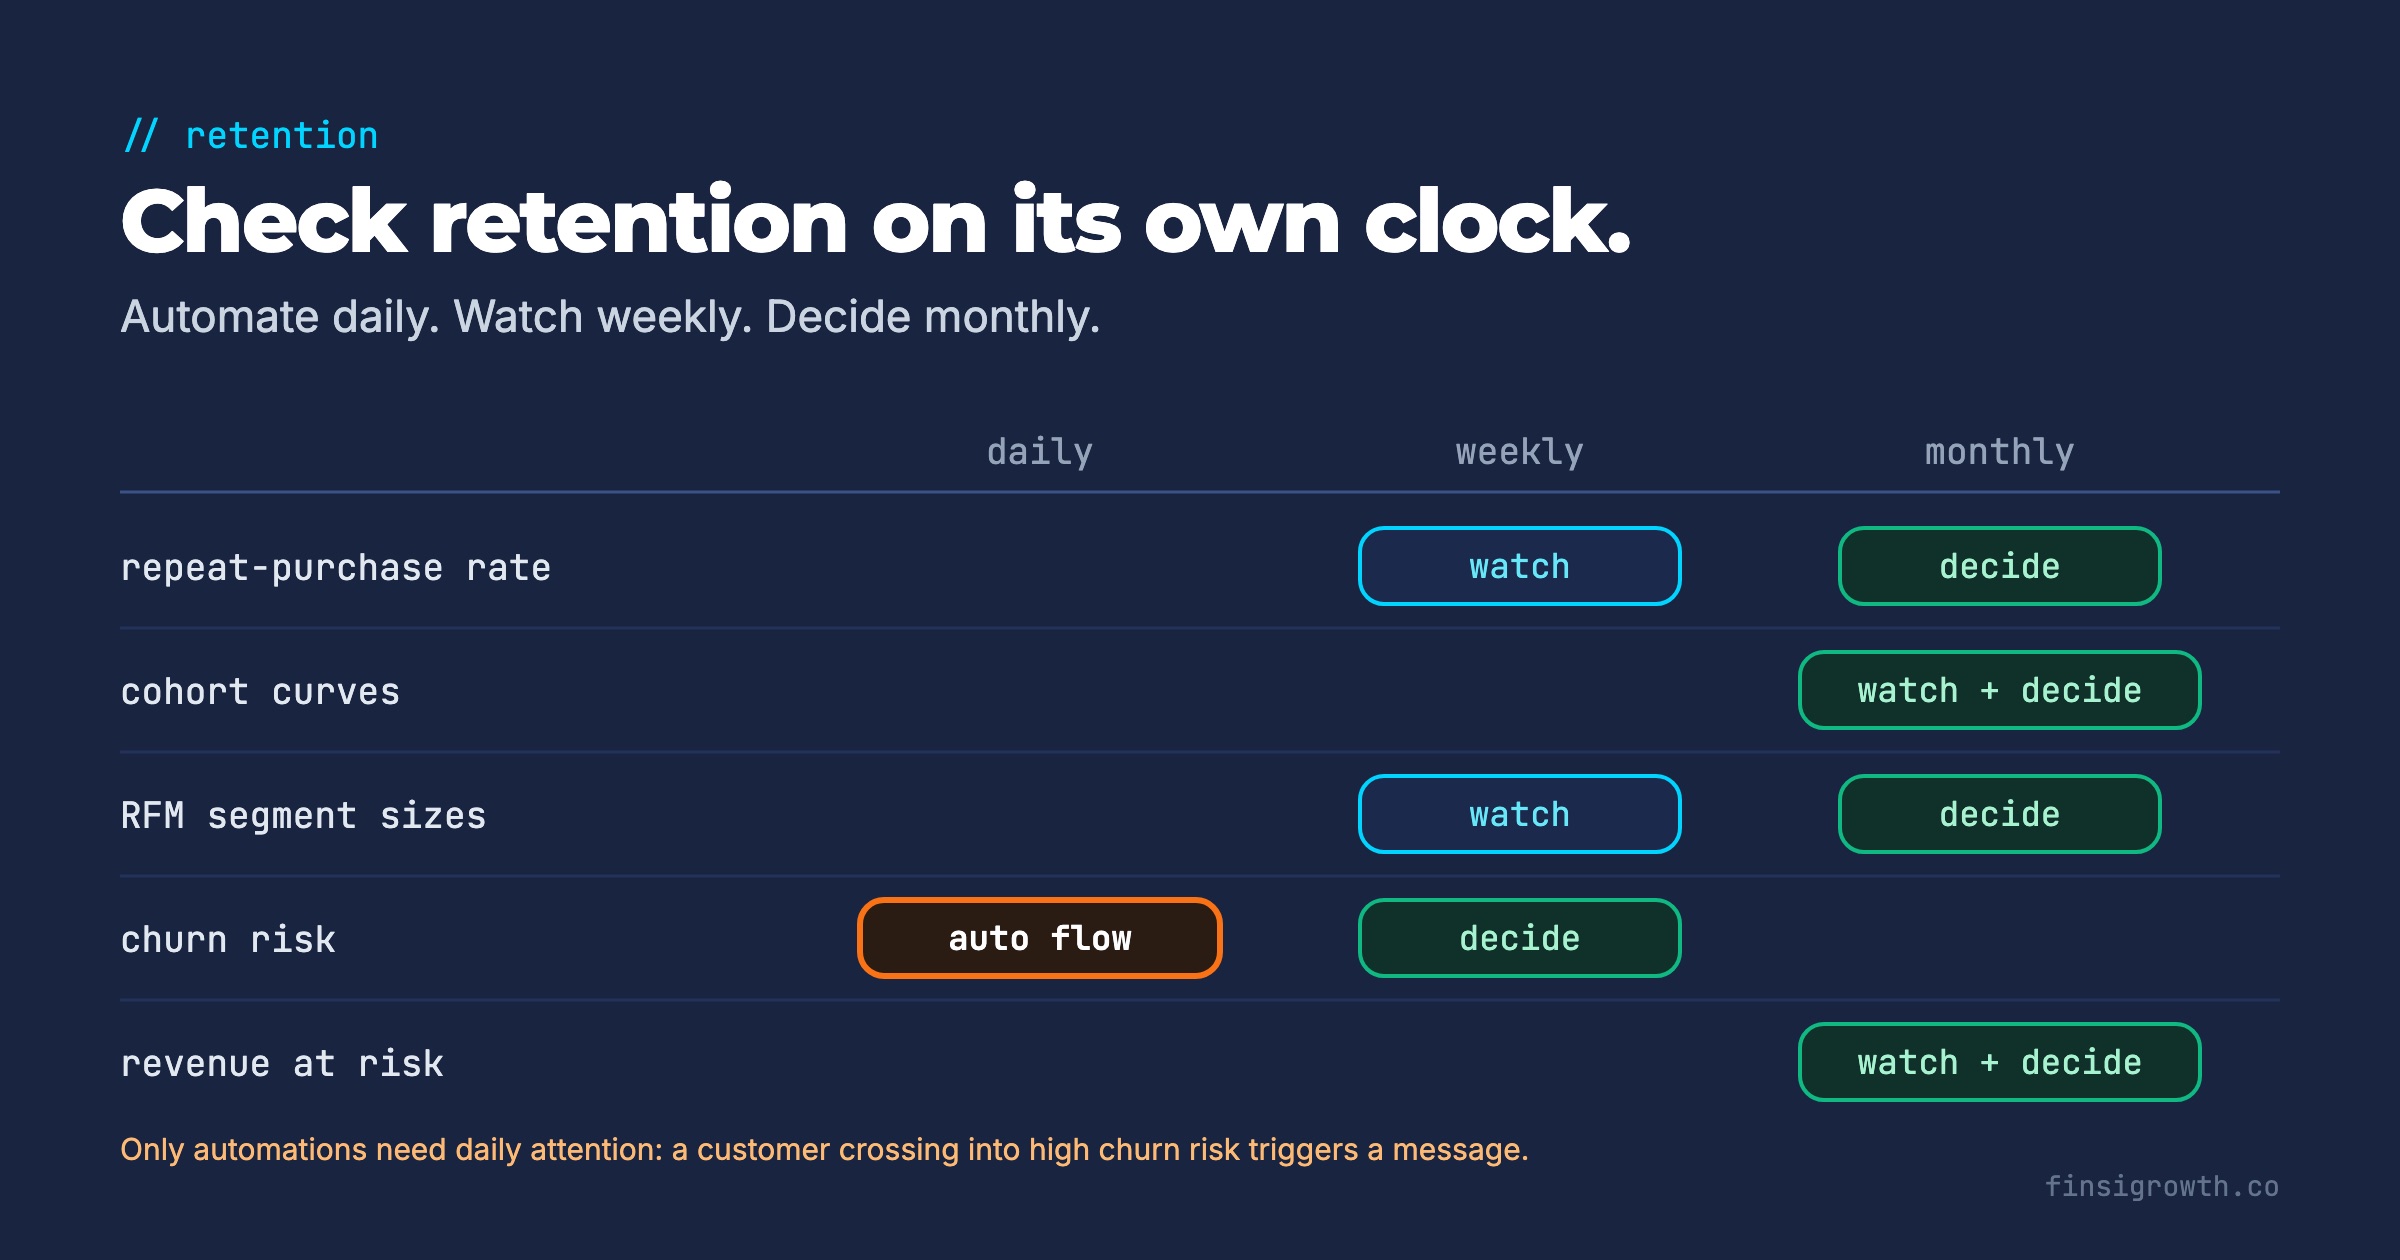
Daily for automated triggers, weekly for review, monthly for decisions. Checking cohort curves every morning mostly shows noise, because a cohort only adds a meaningful data point once a month.
| Metric | Watch | Decide | Where it lives |
|---|---|---|---|
| Repeat-purchase rate | Weekly | Monthly | Shopify cohort report or Klaviyo |
| Cohort retention curves | Monthly | Monthly | Shopify cohort analysis |
| RFM segment sizes | Weekly | Monthly | Shopify RFM report |
| Churn risk | Daily (automated flows) | Weekly | Klaviyo predictive analytics |
| Revenue at risk | Monthly | Monthly (budget review) | Klaviyo segment, spreadsheet |
Only automations need daily attention. A customer crossing into high churn risk or passing their expected reorder date should trigger a message without anyone opening a dashboard.
Frequently Asked Questions
What’s a good repeat-purchase rate for a DTC brand?
It depends heavily on category and price, which is why blanket averages mislead. Use Shopify’s peer benchmarks to compare with similar stores, and track your own trend by cohort. As a reference point, Smile.io’s network data puts the chance of a second order at 27%.
What’s the difference between retention rate and repeat-purchase rate?
Retention rate usually measures the share of customers still active in a later period. Repeat-purchase rate measures the share who placed a second order within a set window. For one-off purchase brands, the repeat-purchase rate is the more useful of the two.
Do I need Klaviyo’s predictive analytics to track churn?
No. Without it, flag repeat customers who are past 1.5× their average time between orders, flag one-time buyers past your repeat window, and use Shopify’s RFM segments. Klaviyo’s predictions appear once you have 500+ customers with orders, 180+ days of history, orders in the last 30 days and some customers with 3+ orders.
Retention isn’t a project. It’s a weekly habit.
Set up the five metrics once, wire the churn triggers into automated flows, and give the rest a fixed weekly slot. When retention slips, you’ll see it in your segments and cohort curves weeks before it shows up in revenue. For the acquisition side of the same equation, see our e-commerce scaling scorecard.