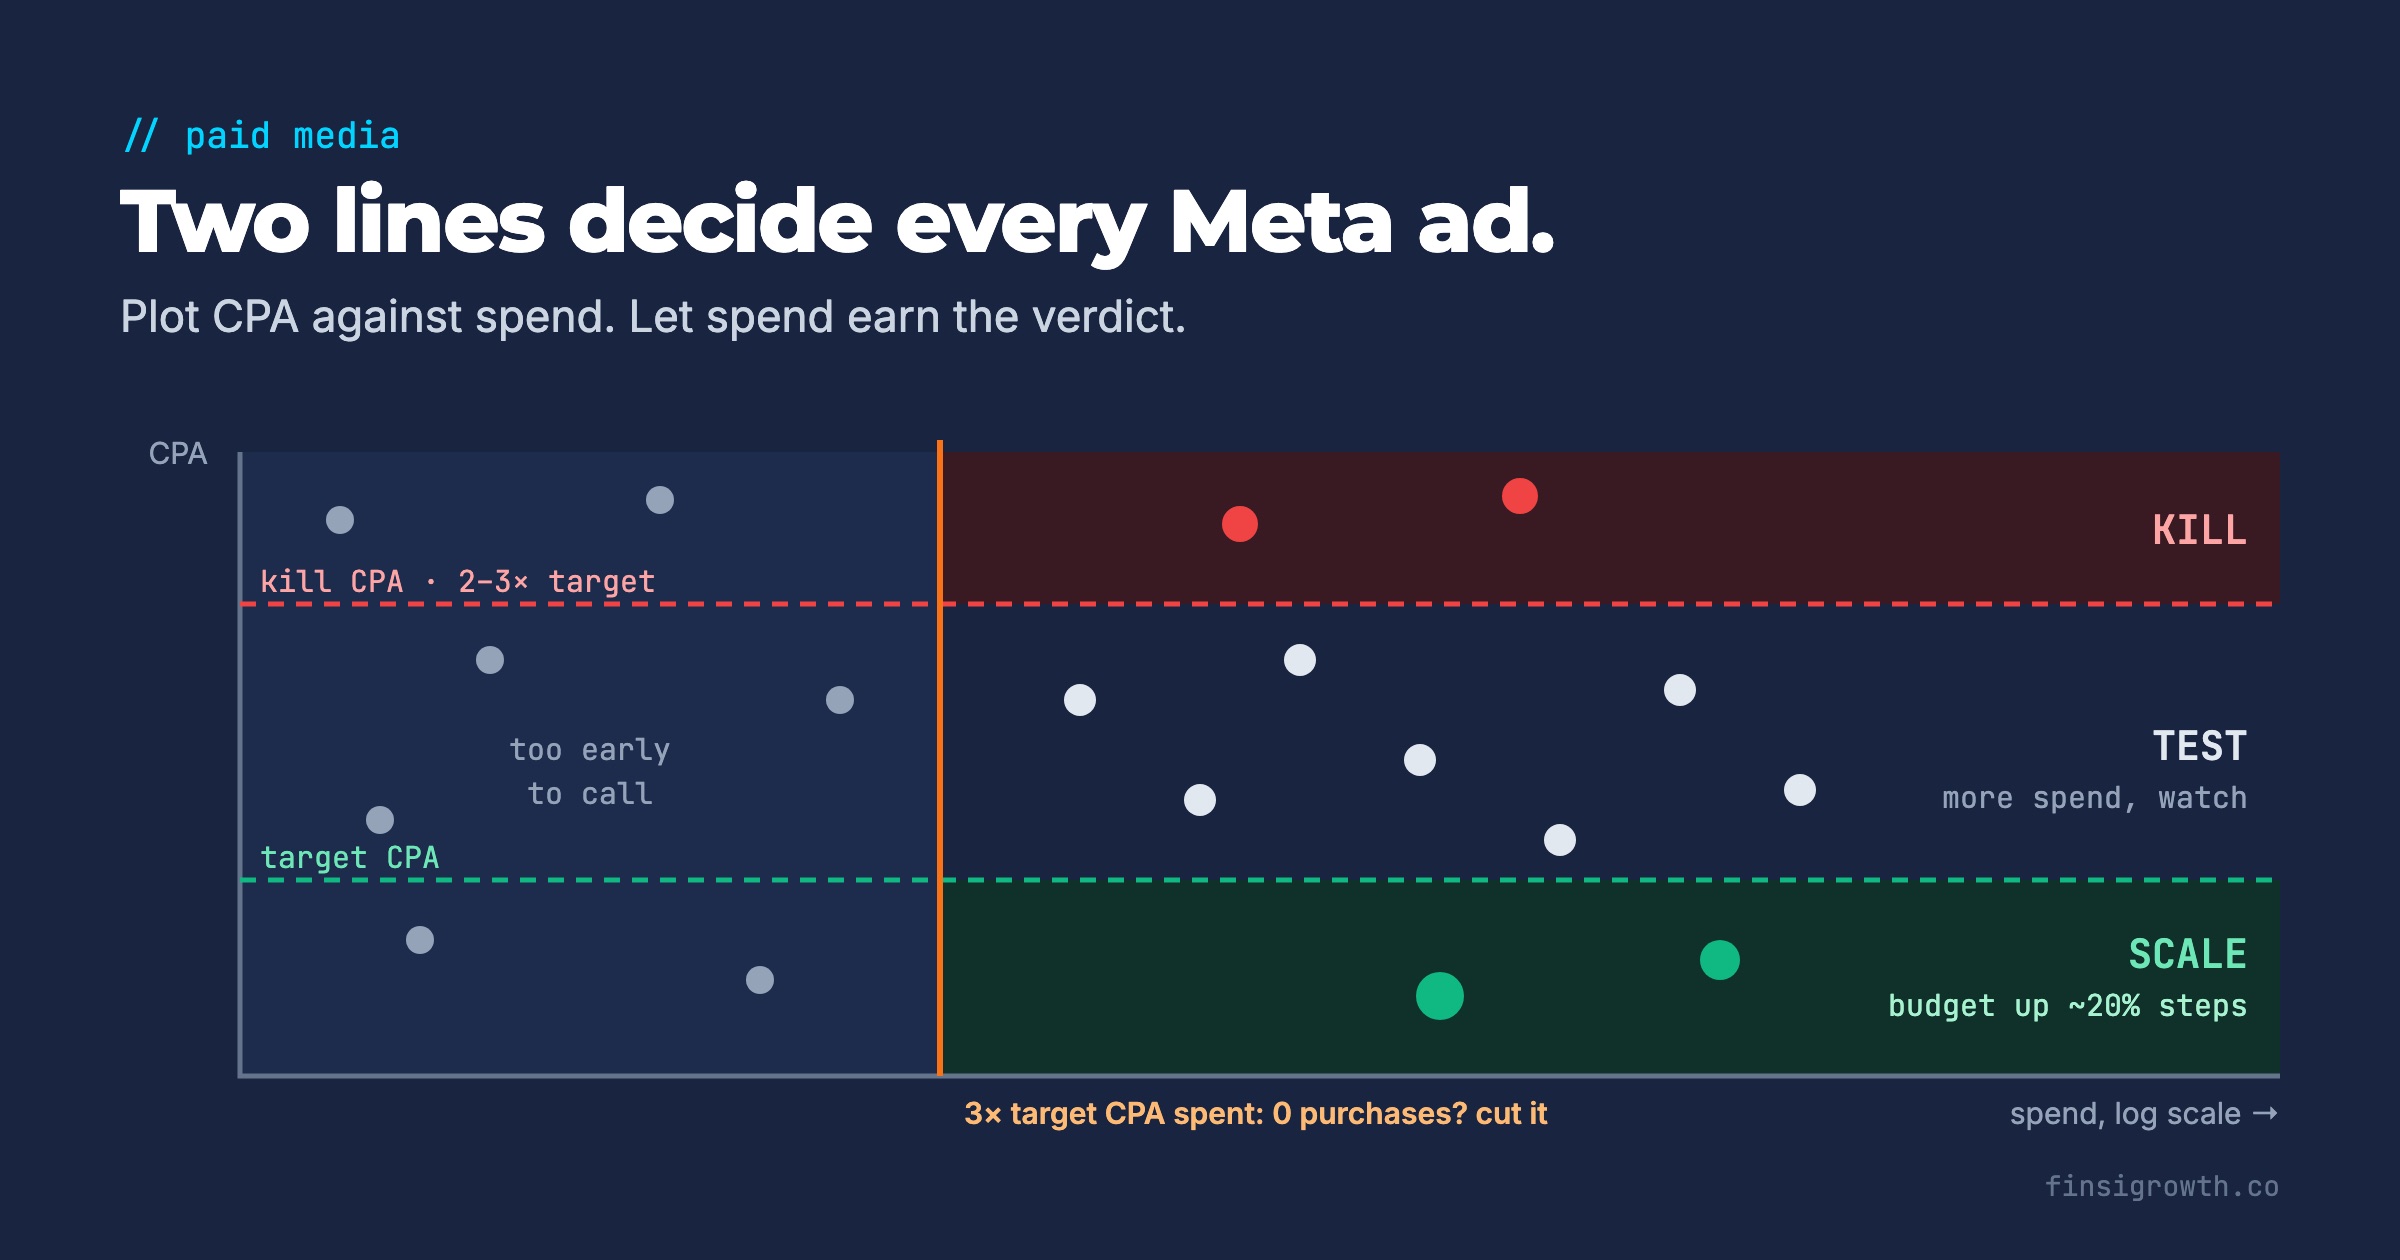
Most ad accounts make kill decisions the same way: someone opens Ads Manager, sees a red CPA, and pauses the ad. Sometimes that ad had spent $40. Sometimes it had spent $4,000 and should have been cut three weeks ago. Same decision, completely different evidence.
The fix is a one-page picture of your account that makes the evidence visible. You plot every ad on two axes, CPA and spend, draw two horizontal lines, and every ad lands in one of three zones: scale, test or kill. The idea comes from a LinkedIn post by Curtis Howland, VP of Marketing at Misfit. In this guide we add three things it leaves open: how to set the lines from your unit economics, how much spend an ad needs before you can trust the call, and where the map misleads you.
Key Takeaways
- Plot each ad’s CPA against its spend on a log scale. A target CPA line and a kill CPA line (2–3× target) split the account into scale, test and kill.
- Set target CPA from contribution margin and your payback window, not from last month’s average.
- Spend alone doesn’t make a verdict. If an ad were truly on target, it would still have zero purchases after 3× your target CPA in spend only about 5% of the time. With one purchase, you need closer to 5×.
- Scale winners gradually. Meta says budget changes may restart learning “depending on the magnitude of the change,” which is why practitioners move budget in steps of about 20%.
- Compare ads only against similar ads (same campaign type, audience and placement) and check every decision against blended numbers like MER.
How do you build the CPA-vs-spend map?
Export ad-level data and make a scatter chart: each dot is one ad, the vertical axis is CPA and the horizontal axis is spend on a log scale. Then draw two horizontal lines, your target CPA and your kill CPA. That’s the whole tool.
Step by step:
- In Ads Manager, switch to the Ads tab and pick one window, such as the last 14 or 28 days.
- Export spend, purchases and cost per purchase for every ad that spent money.
- Plot CPA (y) against spend (x). Set the x-axis to a logarithmic scale.
- Draw the target CPA line.
- Draw the kill CPA line, usually 2–3× target.
- Draw one vertical line at 3× target CPA in spend. Everything to the left of it is “too early to call.”
The log scale matters. Ad spend is extremely lopsided: in Motion’s 2026 analysis of $1.29 billion in Meta spend across 578,750 creatives and 6,015 advertiser accounts, roughly 5% of creatives qualified as winners, and those winners took 55% of total spend (Motion, Creative Benchmarks 2026, updated April 2026; the study measures spend, not ROAS). On a linear axis, a handful of big spenders sit on the far right and every other ad gets crushed into a pile near zero. A log axis spreads them out, so a $200 ad and a $20,000 ad are both readable on the same chart.
How do you set your target CPA?
Your target CPA is the most you can pay for a purchase and still hit your profit goal within the time you’re willing to wait. Derive it from contribution margin, not from what the account happened to average last month.
A simple version:
- First-order breakeven: target CPA = first-order contribution margin before ad spend. If the average order is $80 and 50% is left after product cost, shipping, payment fees and discounts, you can pay up to $40 per purchase and break even on the first order.
- Payback-based: target CPA = contribution margin a customer generates within your payback period. If the same customer adds another $20 of margin within 90 days and you can carry a 90-day payback, your target can stretch to $60.
| Approach | Example target CPA | Use when |
|---|---|---|
| First-order breakeven | $40 | Cash is tight or repeat rates are unproven |
| 90-day payback | $60 | You have reliable cohort data on repeat purchases |
| LTV-based | Higher | Rarely at ad level; keep it for account-level LTV:CAC planning |
One caveat: Meta’s “cost per purchase” counts every attributed purchase, including returning customers. Your true CAC for new customers is usually higher. If your returning-customer share is large, set the target slightly tighter to compensate.
Where should the kill line go?
Put the kill CPA at 2–3× your target. At that level the ad isn’t slightly off; it’s clearly uneconomic, and no realistic optimization will bring it back.
Why not kill at 1.2× target? Because a single ad’s CPA swings a lot from week to week, especially early on, when a handful of purchases more or less changes the number dramatically. A kill line too close to target turns the account into constant churn, cutting ads before they’ve had a fair look. A wide gap between target and kill gives ads room to settle, while the kill line still catches the obvious losers.
Pick 2× if margins are thin or cash is tight. Pick 3× if you’re testing aggressively and can afford to wait.
What do you do with ads in each zone?
Each zone has one job: scale winners, gather more evidence on the middle, and cut losers.
Scale: CPA below target, with real spend behind it
These are your proven winners. Expect very few of them. Curtis puts it at about 1% of ads in the accounts he runs, driving around half of revenue.
- Increase budget gradually. Meta says a significant edit is a pause or a change to the optimization event, audience or creative, and that “changes to bid strategy or budget may also be significant, but it depends on the magnitude of the change” (Meta Business Help Center, Last Significant Edit). Meta doesn’t publish a safe percentage. Moving budget about 20% at a time is a widely used practitioner rule of thumb, not a Meta number.
- Make new variations of the winning ad (new hook, new first frame, new format) so you’re not relying on one creative.
Test: CPA between target and kill
This is most of your account. Curtis estimates 65% or more of ads sit here. These ads aren’t failing, they’re unproven.
- Give them more spend and watch which way they move. If CPA drifts toward target, move them toward scale. If it climbs past the kill line, cut them.
- Don’t judge them before they’ve spent 3× your target CPA (see the next section).
Kill: CPA above the kill line, with enough spend to be sure
Pause them. Ideally this zone is empty. If an ad got this far, it was cut too slowly.
How much spend does an ad need before you can judge it?
Judge ads on how many purchases they’ve produced compared with how much they’ve spent, not on spend or time alone. A $500 ad with 10 purchases and a $500 ad with 1 purchase have the same spend but very different reliability.
There’s a simple way to put a number on it. If an ad were truly hitting your target CPA, it would produce roughly one purchase per target CPA of spend. Purchases are rare, random events, so you can use basic probability (a Poisson model) to ask: if this ad were really on target, how likely is it that we’d see this few purchases by now? When that chance is small, you can be confident the ad isn’t on target.
| Purchases so far | 90% confidence it misses target after spending | 95% confidence after spending |
|---|---|---|
| 0 | 2.3× target CPA | 3.0× target CPA |
| 1 | 3.9× | 4.7× |
| 2 | 5.3× | 6.3× |
| 3 | 6.7× | 7.8× |
What this means in practice:
- Zero purchases at 3× target CPA spent: cut it. If it were really on target, you’d see no purchase that late only about 5% of the time. Strictly, that proves the ad is missing target, not that it’s past your kill line. Treat it as a stop-loss: the ad has shown no signal at all, and more spend is unlikely to change that.
- One purchase: wait until about 4–5× target CPA before you call it.
- Two or more purchases: the ad already has a measured CPA, so use the kill line, but only once spend is about 5× target or more.
This is why the map has a vertical line at 3× target spend. An ad to the left of it with a terrible CPA isn’t a loser yet. It’s just early.
Two practical adjustments:
- Conversion lag. Purchases are credited to the ad for days after the click, so the last few days of spend look worse than they are. Leave the most recent 2–3 days out of the kill decision.
- Low-spend ads haven’t been tested. When an ad set holds several ads, Meta shows each person the ad most likely to get the lowest cost, so “each of your ads won’t necessarily be delivered the same number of times” (Meta Business Help Center, Ad Delivery). An ad Meta barely served isn’t a proven loser. If a concept matters, test it in its own ad set or with Meta’s A/B testing tool.
When does the CPA map mislead you?
The map compares ads against each other, so it breaks down when those ads aren’t comparable or when attributed CPA isn’t the real cost. Check these four things before acting on it.
- Different jobs, different CPAs. Retargeting ads almost always look cheaper than prospecting ads because they reach people who were already close to buying. Plot each campaign type separately, or set separate targets for each. Several commenters on Curtis’s post made the same point: an ad’s numbers mean more against similar ads in the same campaign and placement than against the whole account.
- Assists don’t show up on the chart. Some upper-funnel ads drive purchases that get credited to other ads. Before cutting a whole category of ads, check what happened to MER and blended ROAS the last time you cut similar ones.
- Attributed CPA isn’t incremental CPA. Meta’s standard attribution setting credits a purchase to an ad within 7 days of a click or 1 day of a view (Meta Business Help Center, About attribution setting). In March 2026, Meta also changed its reporting so only link clicks count as clicks, with likes, shares and saves reported separately as “engage-through” attribution (Meta, Simplifying Ad Measurement for a Social-First World, March 3, 2026). Either way, the CPA in Ads Manager includes purchases that might have happened anyway.
- Learning phase noise. Meta’s delivery system needs “around 50 optimisation events in the week after your last significant edit” to leave the learning phase (Meta Business Help Center, About learning limited). Ads in an ad set that’s still learning have unstable CPAs, so give them a wider margin.
What does the weekly routine look like?
Fifteen minutes, once a week, same day, same lookback window.
- Export ad-level spend and purchases for the last 14 or 28 days.
- Drop the newest 2–3 days of spend from kill decisions.
- Plot the map, one chart per campaign type.
- Scale: raise budget on green ads in roughly 20% steps and brief new variations of each winner.
- Kill: pause red ads, plus any ad with zero purchases after 3× target CPA in spend.
- Test: leave yellow ads running and note which ones moved toward target since last week.
- Check that account-level contribution margin and MER held up. If ad-level CPAs improved but MER fell, the map is missing something.
If you also want the account-level view (when to scale or pull back total spend, not individual ads), our e-commerce scaling scorecard covers the five metrics we check weekly.
If you’d rather have this map built, refreshed and checked against your real margins every week, that’s part of what Finsi Growth does for DTC brands.
Frequently Asked Questions
Should I use CPA or ROAS for the map?
Use CPA when order values are fairly similar across products. If average order value varies a lot by ad (one ad sells a $30 item, another a $300 bundle), plot ROAS instead and flip the lines: a target ROAS floor and a kill ROAS below it. The zones and the spend rule work the same way.
How long should I wait before killing a new Meta ad?
Wait for spend, not days. If an ad has spent 3× your target CPA with zero purchases, an on-target ad would show that result only about 5% of the time, so you can cut it. With one purchase, wait until roughly 4–5× target CPA.
What if most of my ads sit in the “too early to call” zone?
That usually means Meta is putting most of the budget behind a few ads, which is normal delivery behavior. Don’t kill the rest on thin data. If an idea deserves a fair test, give it its own ad set or budget so it actually gets spend.
Does this work for TikTok or Google Ads?
Yes. The map and the spend rule are platform-neutral: plot CPA against log spend, set target and kill lines from your margins, and wait for enough purchases. Only the platform-specific advice on learning phases and budget changes differs.