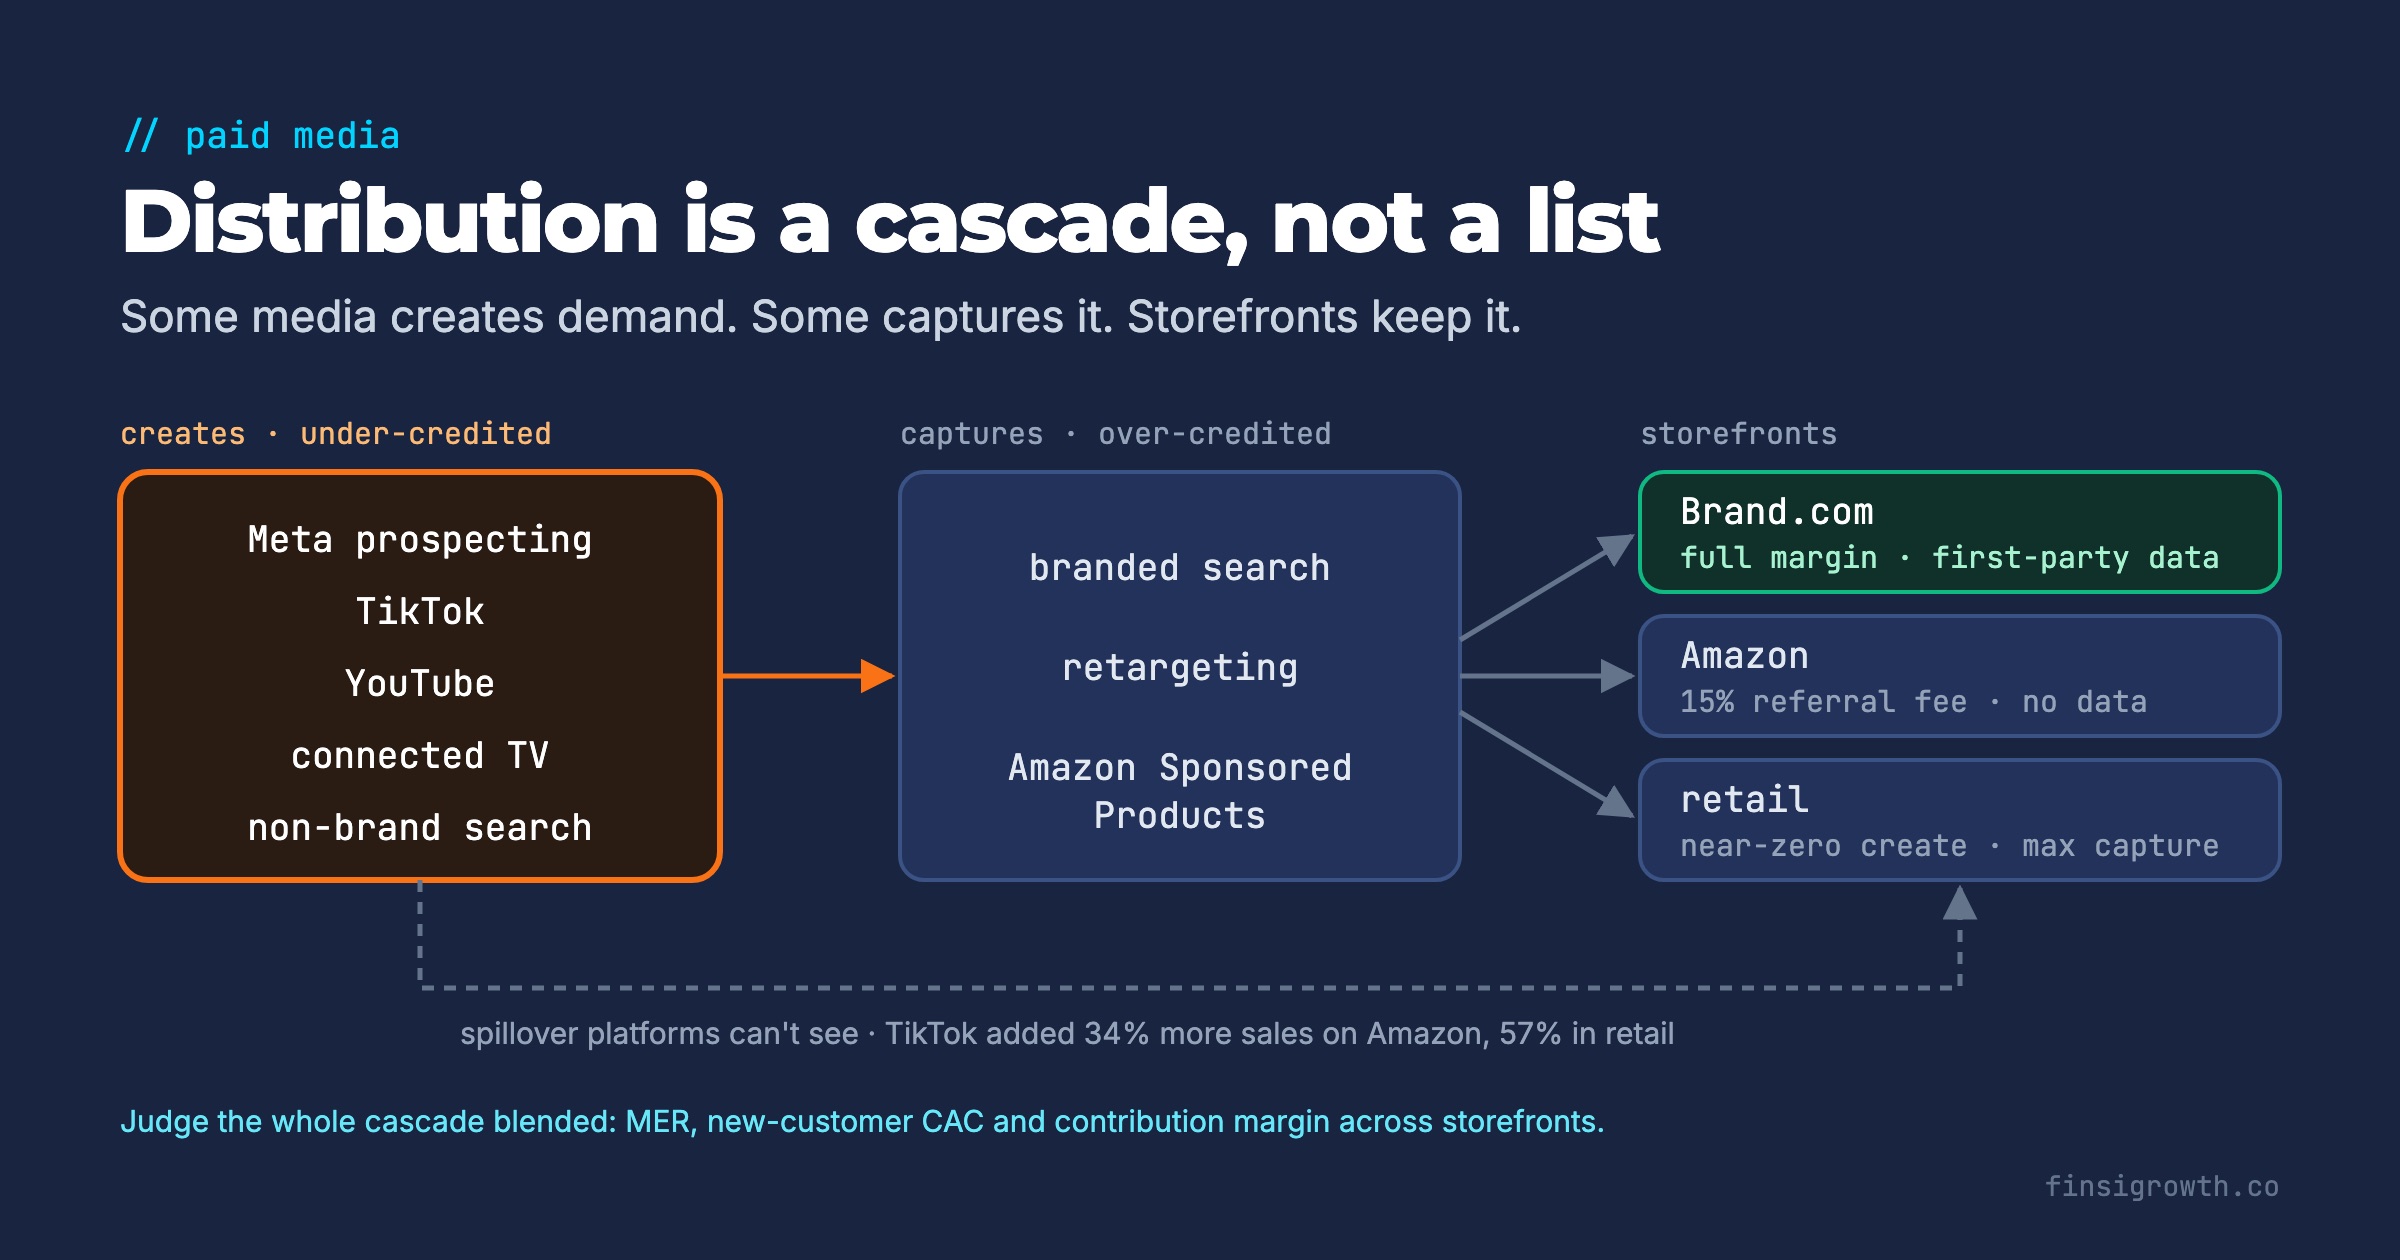
Most DTC channel plans are still a list: Meta, Google, TikTok, Amazon, email. Each line gets a budget and a ROAS target, and each is judged on its own dashboard.
That’s not how customers buy. Common Thread Collective has a better name for it: distribution is a demand cascade (CTC, May 2026). Some media creates demand. Other media captures it. The demand flows down through every place you sell, and you budget the whole system, not the line items.
This guide covers how the cascade works, why channel-level ROAS gets it backwards, why the same platform can sit at both ends, and how to measure and budget it.
Key Takeaways
- Demand-creation media (Meta prospecting, TikTok, YouTube, CTV) puts your brand in front of people who weren’t looking. Demand-capture media (branded search, retargeting, Amazon Sponsored Products) converts people who already are.
- Attribution under-credits creation and over-credits capture. In Haus’s experiments, TikTok drove an extra 34% of sales on Amazon and 57% in physical retail on top of DTC.
- Classify campaigns, not platforms. Google YouTube and non-brand search create demand; Google branded search captures it. They belong in different parts of the cascade.
- Every storefront has a different margin. Demand that lands on Amazon pays a referral fee of 15% in most categories and leaves you no customer data.
- Judge the cascade on blended numbers: MER, new-customer CAC and contribution margin across all storefronts.
What is a demand cascade?
A demand cascade maps distribution by what each campaign does, not by where the sale was recorded. Creation media generates interest among people who weren’t shopping. Capture media meets people who already are. Storefronts sit in between, each creating and capturing in different proportions.
Read the storefronts from top to bottom:
- TikTok Shop is discovery commerce. It creates a lot of demand and captures relatively little of it. US GMV reached an estimated $15.1B in 2025 (Momentum Works via DealStreetAsia, Feb 2026).
- Brand.com is the balanced middle. It’s your full-margin storefront and the only one that gives you complete first-party customer data.
- Amazon creates little demand but captures a lot. It’s where much branded search lands. A 2024 Jungle Scout survey found 56% of US shoppers start product searches on Amazon (Practical Ecommerce).
- Retail creates almost no demand of its own. It captures whatever reaches the shelf.
CTC’s own summary of the capture end is blunt: “There’s rarely a step further down the funnel from Amazon.”
Why does channel-level ROAS get the cascade backwards?
Because platform attribution records where a sale finished, not where the demand started. That systematically flatters capture channels and shortchanges creation channels. CTC puts it directly: capture channels like Google branded search and Amazon Sponsored Ads “tend to overreport” their impact.
Capture channels look better than they are
The classic evidence comes from eBay. Economists Blake, Nosko and Tadelis ran controlled experiments on eBay’s paid search and found brand-keyword ads had “no measurable short-term benefits” (NBER Working Paper 20171, published in Econometrica, 2015). When eBay stopped bidding on its own name, 99.5% of that traffic arrived through the organic link anyway.
eBay is an extreme case: a huge brand with nobody bidding against it. Later research on thousands of brands in Bing found branded ads matter more when competitors bid on your name. In that case, competitors captured 18–42% of clicks when the brand stopped bidding (Simonov, Nosko & Rao, Marketing Science, 2018).
Incrementality testing vendor Haus found the same pattern in its branded search experiments. The average incrementality factor was 0.37 for brands facing heavy competition and 0.09 for low-competition brands (Haus, Sep 2025).
An incrementality factor of 0.09 means that for every 100 sales Google credits to branded search, about 9 wouldn’t have happened without the ad. The other 91 would have come through the organic link.
That doesn’t mean you turn branded search off. If competitors bid on your name, it’s partly defensive. It means branded search ROAS is mostly a measure of demand created somewhere else.
Creation channels look worse than they are
The other half of the problem is spillover. Demand created by an ad converts in a storefront that ad platform can’t see.
Haus’s analysis of 640 Meta incrementality tests found that for brands doing at least 25% of their business outside DTC, about 32% of Meta’s impact landed in those non-DTC channels (Haus, The Meta Report, Jul 2025). The effect is larger for TikTok:
Haus found TikTok drove an additional 34% of sales on Amazon and 57% in physical retail, so it delivered 1.9x the value when measured across channels instead of DTC-only (Haus, The TikTok Report, Dec 2025). CTC reports a similar pattern in its own client base: 20–50% spillover from DTC media into Amazon.
Most of these numbers come from one vendor’s experiment database, so treat them as one strong signal, not several. The direction is consistent, though. If you judge TikTok or Meta prospecting on DTC ROAS alone, you’ll cut the campaigns that are feeding your Amazon and retail sales.
Why does the same platform show up on both sides?
Because a platform isn’t a channel. A campaign is. Google is the clearest example. A YouTube campaign, a Demand Gen campaign or a non-brand search ad for “best protein powder for women” reaches people who don’t know you yet. That’s demand creation. A search ad on your brand name reaches people who already typed it. That’s demand capture.
Those are two different parts of the funnel with two different jobs, but most reports roll them into one line called “Google.” The blended Google ROAS looks healthy because the branded half inflates it. The non-brand half, the part creating new demand, is either hidden or cut.
The same split shows up on most platforms:
| Platform | Creates demand | Captures demand |
|---|---|---|
| YouTube, Demand Gen, non-brand search and Shopping | Branded search, brand terms inside Performance Max | |
| Meta | Broad prospecting to new audiences | Retargeting site visitors and past customers |
| Amazon | Sponsored Brands and DSP on category and competitor terms | Sponsored Products on your own brand terms |
| TikTok | Feed ads and GMV Max reaching new viewers | Retargeting and Shop search |
What to do about it:
- Split every platform report into creation and capture campaigns. For Google, separate branded from non-brand search, and use brand exclusions in Performance Max so it can’t quietly bid on your name.
- Give each half a different target. Capture campaigns should be held to strict efficiency, because most of their sales would happen anyway. Creation campaigns should be judged on new customers and blended results, not platform ROAS.
- Watch branded search as an output. Rising branded search volume is one of the clearest signals that your creation spend is working. It’s demand you made, showing up where people look for you.
Does it matter which storefront captures the demand?
Yes, because each storefront keeps a different share of the revenue and gives you different data. A sale on Brand.com keeps full margin and gives you the customer’s email, order history and repeat behavior. The same sale on Amazon pays a referral fee of 15% in most categories, plus fulfillment and advertising costs (Amazon seller pricing), and you don’t own the customer relationship.
That changes how you value a creation campaign. If a Meta campaign produces $10,000 of DTC revenue and $3,000 of Amazon revenue, the second number matters, but it’s not worth the same as the first. Count it at its own contribution margin, not at full price.
It also changes the long game. Your LTV model, cohort data and retention programs live on Brand.com. Demand that cascades to Amazon is real revenue, but it doesn’t build the customer base you can email next month. A healthy cascade keeps Brand.com strong as the data spine, even when Amazon captures a growing share.
How do you measure a demand cascade?
With blended numbers first and experiments second. Platform dashboards can’t see across storefronts, so the measurement has to sit above them.
1. Run a blended scorecard weekly. Track MER (total revenue across all storefronts divided by total ad spend), new-customer CAC and contribution margin after ad spend. If creation spend rises and these improve, the cascade is working, whatever the platform ROAS says.
2. Track the flow, not just the totals. Each week, look at branded search volume, Amazon sales and direct traffic alongside creation spend. Rising branded demand after creation spend goes up is the cascade made visible.
3. Test incrementality with geo holdouts. Turn a campaign off, or up, in a set of regions and compare sales across every storefront, not just DTC. CTC names geo-holdout tests, matched-market studies and platform conversion-lift studies as its main tools.
4. Calibrate a media mix model with those tests. Meta’s open-source Robyn describes MMM as “the established measurement solution for holistic, cross-channel sales measurement” and recommends calibrating it with experiments (Robyn docs). Google’s Meridian does the same with its GeoX experiments.
You don’t need all four on day one. A $3M brand can start with step 1 this week and run its first geo test next quarter.
How should you budget the cascade?
Budget by job, not by platform. Here’s the order we’d work in.
- Map every campaign to creation or capture. Use the table above. Any campaign that mixes both, like Performance Max with brand terms, gets split or fenced.
- Set the system target first. Decide the blended MER and new-customer CAC you need to hit your payback period. That’s the constraint every channel answers to.
- Fund capture to cover existing demand, no more. Spend enough on branded search and retargeting to defend against competitors, then stop. Extra capture spend mostly buys sales you’d already have.
- Put growth money into creation. New demand comes from creation media. Scale it while blended numbers hold, and cut it when they don’t.
- Read creation campaigns on a longer window. Spillover into Amazon, retail and branded search takes time. Seven-day platform ROAS will undervalue it.
For deciding when an individual Meta ad deserves more budget, see our guide on when to kill or scale a Meta ad. For the account-level view, the e-commerce scaling scorecard covers when to push spend and when to hold.
The shift is simple to say and hard to run: stop asking which channel made the sale and start asking which campaign made the demand. If you’d like your channel mix mapped into a cascade and measured against your unit economics every week, that’s what Finsi Growth does for DTC brands.
Frequently Asked Questions
What is a demand cascade in e-commerce?
It’s a model of distribution that sorts media into demand creation and demand capture, and storefronts by how much they create versus capture. Demand created by ads flows down into Brand.com, Amazon and retail, so you budget and measure the whole system together.
What’s the difference between demand creation and demand capture?
Demand creation reaches people who weren’t looking for you, such as Meta prospecting, TikTok, YouTube and non-brand search. Demand capture converts people who already are, such as branded search, retargeting and Amazon Sponsored Products on your brand terms.
Is Google search demand creation or demand capture?
Both, depending on the campaign. Non-brand search, YouTube and Demand Gen create demand. Branded search captures demand that already exists. Report and target them separately, because blending them makes Google look more efficient than its demand-creating campaigns really are.
Should I turn off branded search?
Not automatically. Research on eBay found branded ads added almost nothing when no competitors bid on the name. When competitors do bid, defending your brand terms pays off. Run a holdout test before deciding, and keep spend no higher than defense requires.
How do I measure Amazon sales driven by Meta or TikTok ads?
Platform attribution can’t see them. Use geo-holdout tests that measure sales across every storefront, track Amazon sales against creation spend weekly, and calibrate a media mix model such as Robyn or Meridian with those test results.