Ask a founder what their brand is worth and you’ll usually get one number: earnings times a multiple. That number is real, but it isn’t what lands in your bank account. Debt comes off. Working capital gets trued up. Fees come out. Part of the price is held back or paid later, if at all.
The framing comes from a LinkedIn post by Curtis Howland, VP of Marketing at Misfit, who says he has helped five DTC brands sell for $500M+. He ran a $12M brand through his valuation model and got $9.7M of enterprise value but $5.6M of cash at close. That’s 58 cents on the headline dollar on closing day.
We built an open version of that model. The DTC Valuation Calculator runs in your browser and nothing you type leaves it. This guide walks through the same five steps with a worked example, and shows where each number comes from.
Key Takeaways
- A DTC brand is valued as adjusted EBITDA × a multiple. Under about $1M of earnings, buyers price on seller’s discretionary earnings (SDE) instead.
- Size sets the starting multiple. In Q2 2026, deals under $500k averaged 2.0× SDE, while $5M–$50M deals averaged 5.8× EBITDA (IBBA).
- Quality moves it from there. One turn of multiple on $2.2M of EBITDA is $2.2M of price.
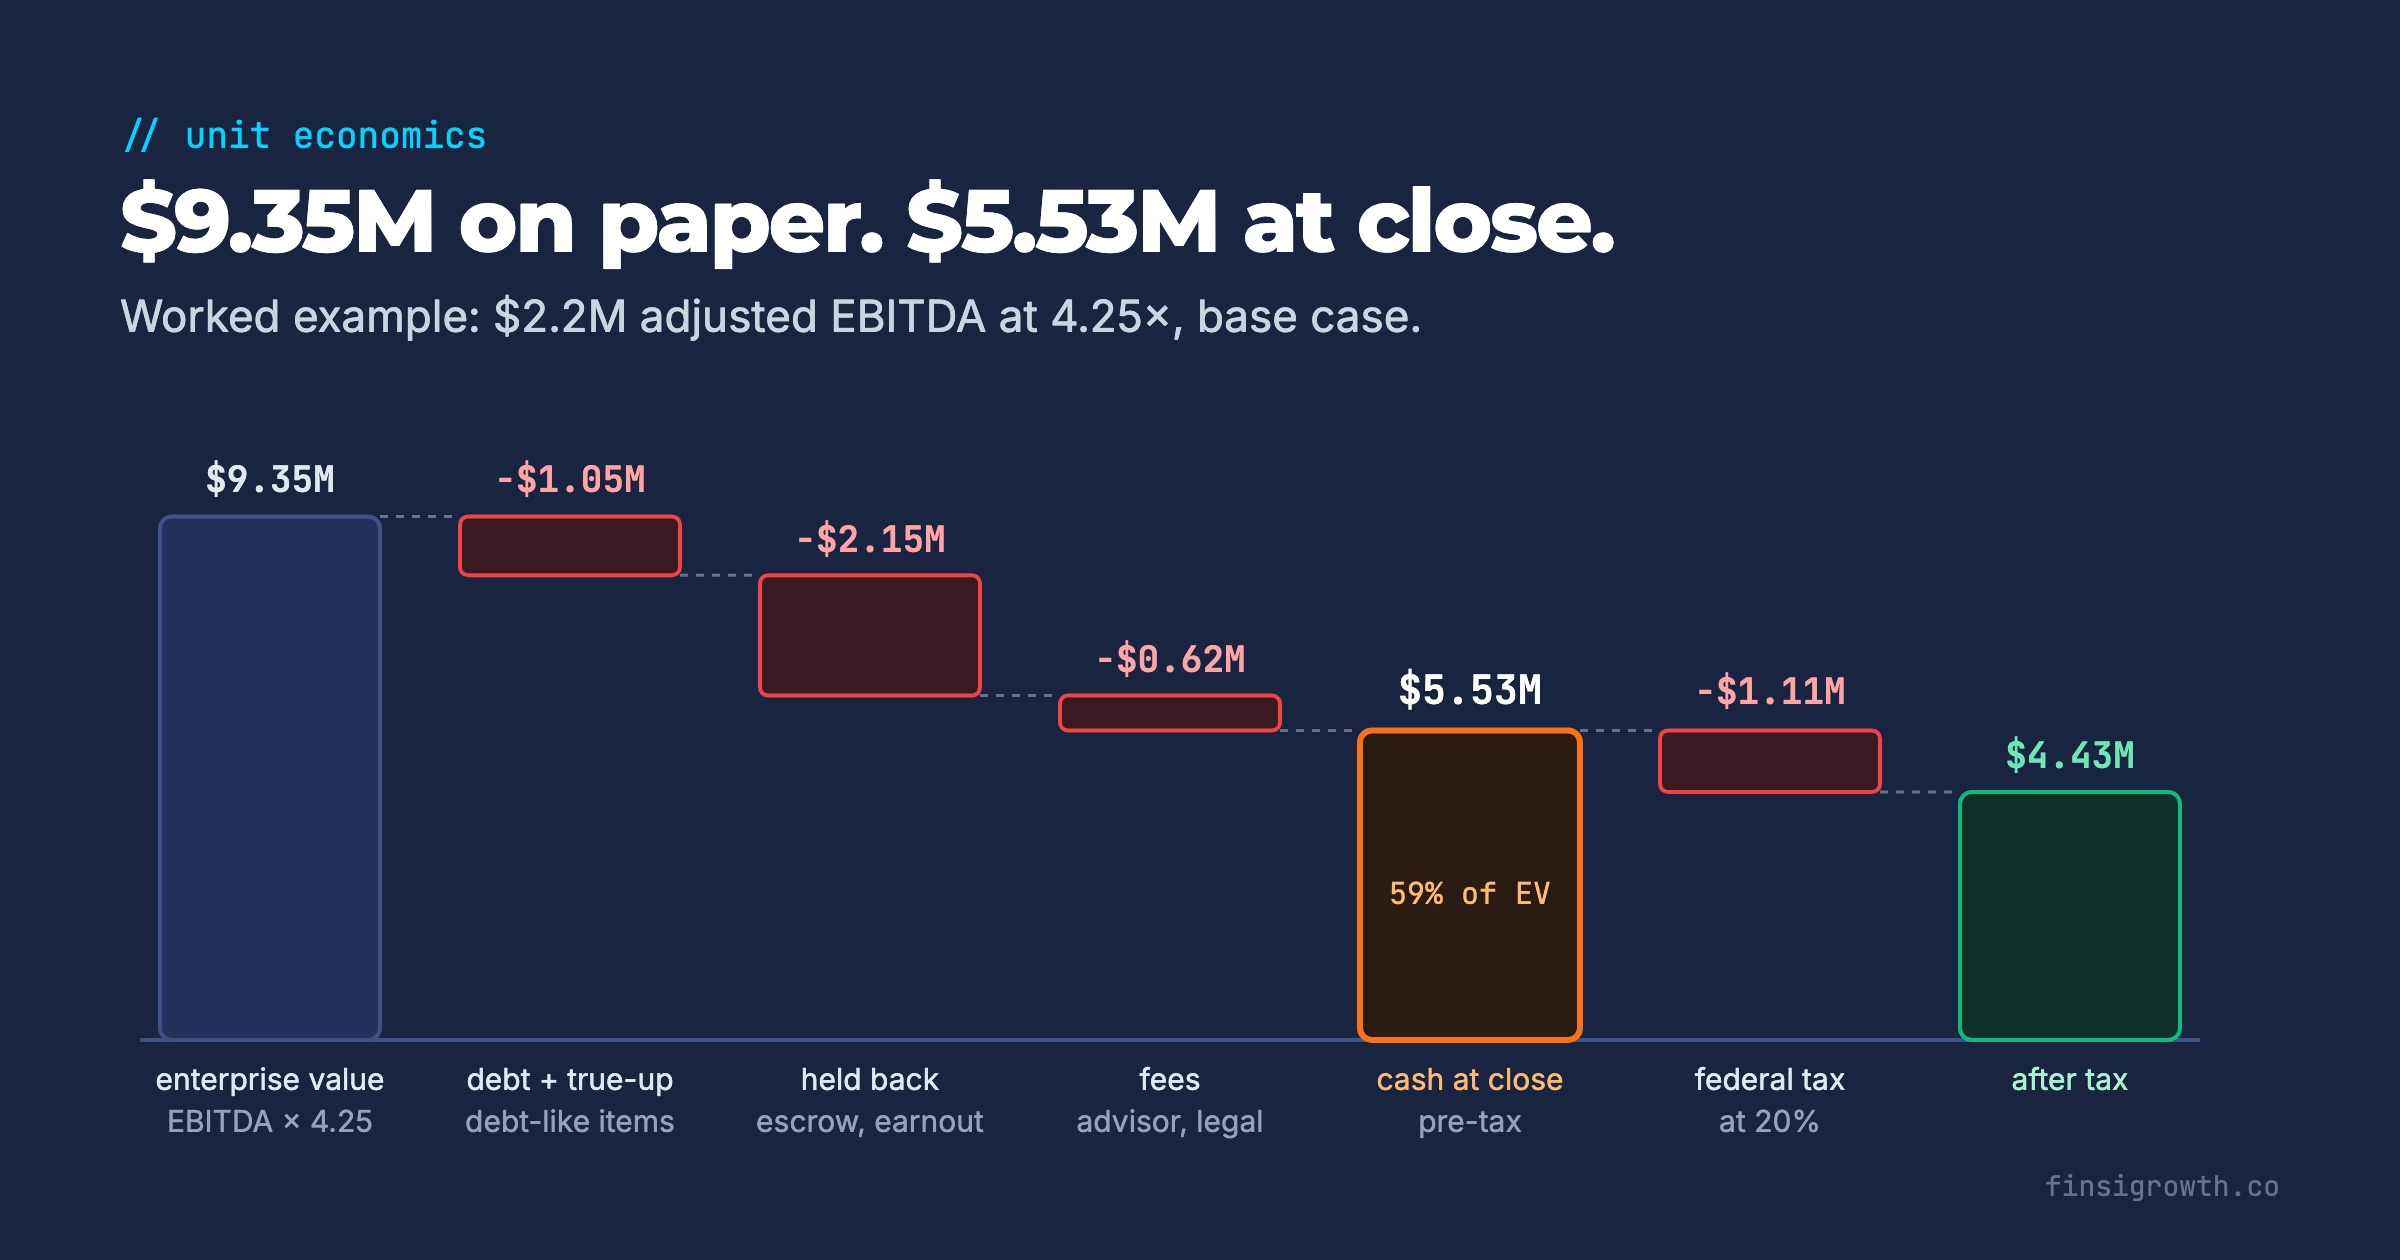
- Enterprise value isn’t cash. In our worked example, $9.35M of enterprise value becomes $5.53M at close before tax, and $4.43M after federal tax.
- Expensive financing doesn’t change your multiple, but its balance comes off the price at close. A 13% fee repaid over six months is roughly a 50% APR.
How is a DTC brand valued?
Buyers value a DTC brand on its adjusted EBITDA, multiplied by a multiple. Adjusted EBITDA is earnings before interest, taxes, depreciation and amortization, plus costs that won’t continue under a new owner. The multiple depends mostly on size, then on the quality and risk of those earnings.
Small deals use a different earnings measure. SDE (seller’s discretionary earnings) adds back all of the owner’s pay, because the buyer of a small business usually replaces the owner themselves. The IBBA and M&A Source survey measures deals under $2M purchase price on SDE and larger ones on EBITDA. Website Closers puts the shift to private equity buyers and EBITDA pricing at roughly $5M of revenue or about $1M of earnings (Website Closers, Sep 2026).
Revenue multiples get quoted on LinkedIn, but for a profitable consumer brand they’re a shortcut, not the method. Two $12M brands with 5% and 20% EBITDA margins aren’t worth the same.
Step 1: Turn your P&L into adjusted EBITDA
Start with the last 12 months, often called TTM (trailing twelve months). Reported EBITDA is revenue minus cost of goods sold, marketing and operating expenses. Then add back costs a new owner won’t carry, and subtract costs they’ll have to add.
Here’s the worked example we’ll use throughout. It’s a hypothetical brand, not a client.
| Line | Amount | Note |
|---|---|---|
| Net revenue | $12,000,000 | Up 15.4% from $10.4M the year before |
| Cost of goods sold | −$4,800,000 | 60% gross margin |
| Marketing | −$3,400,000 | 28.3% of revenue |
| Operating expenses | −$2,000,000 | Payroll, software, rent |
| Reported EBITDA | $1,800,000 | 15% of revenue |
| Owner pay above market | +$150,000 | Founder pays themselves $150k more than a hired operator would cost |
| One-time costs | +$200,000 | A rebrand that won’t repeat |
| Personal expenses | +$50,000 | Car and travel run through the business |
| Adjusted EBITDA | $2,200,000 | 18.3% of revenue |
Add-backs are where valuations get argued down. A buyer’s quality-of-earnings (QoE) review will test each one against invoices and bank statements. A good rule: if you can’t document an add-back, don’t count it. If add-backs are more than about a quarter of adjusted EBITDA, the calculator flags it, because that’s the part of your number most likely to shrink in diligence.
Also look for negative adjustments. If a family member works unpaid, or you rent your warehouse from yourself below market, a buyer will add that cost back in.
Step 2: Find your starting multiple
Size is the biggest single driver. Bigger, steadier earnings attract more buyers and cheaper financing, so each dollar of EBITDA is worth more.
The calculator sets its starting band by adjusted EBITDA, using Website Closers’ published ranges and cross-checking them against deal surveys:
| Adjusted EBITDA | Typical multiple | Cross-checks |
|---|---|---|
| Under $500k | 2.3–3.3× SDE (e-commerce brands) | IBBA: 2.0–3.1× SDE for deals under $2M |
| $500k–$1M | 3.0–4.5× EBITDA | |
| $1M–$3M | 4.0–6.0× EBITDA | IBBA: 4.0× for $2M–$5M deals; FE International: DTC brands “around 3× to 5×” EBITDA |
| $3M–$10M | 5.5–7.5× EBITDA | IBBA: 5.8× for $5M–$50M deals |
| $10M+ | 7–10×+ EBITDA, industry dependent | GF Data: 6.4× for PE deals at $10–25M enterprise value (2024); Capstone: consumer M&A median 9.2× (2025) |
Sources: Website Closers, IBBA, FE International, GF Data, Capstone Partners.
Two things to keep in mind. Capstone’s 9.2× median for 2025 was the lowest in its ten years of tracking consumer deals, so the market isn’t generous right now. And in IBBA’s Q2 2026 survey, advisors put consumer products near the bottom of 14 sectors for buyer interest. A consumer brand has to earn its multiple with quality.
Our example brand has $2.2M of adjusted EBITDA, so it starts in the $1M–$3M band: 4.0× low, 5.0× base, 6.0× high.
Step 3: Price the 8 levers that move your multiple
Within a size band, buyers pay more for earnings they trust will continue. The calculator prices eight levers in turns, where one turn is 1× EBITDA. On our example, one turn is worth $2.2M of price.
| Lever | What a buyer is checking | Range in the calculator |
|---|---|---|
| Revenue growth | Is the business growing, flat or shrinking? | −1.0 to +1.0 |
| Gross margin | Room to absorb rising costs and still fund growth | −0.5 to +0.25 |
| Paid-media dependence | How much revenue stops if ad spend stops | −0.75 to +0.25 |
| Repeat revenue | Share of revenue from returning customers or subscriptions | −0.5 to +0.75 |
| Channel concentration | Exposure to a single marketplace or retail account | −0.75 to 0 |
| Product concentration | Exposure to one hero SKU | −0.5 to 0 |
| Owner dependence | Whether the business runs without the founder | −0.75 to +0.25 |
| Quality of financials | Whether the books survive a QoE review | −0.75 to +0.25 |
Be clear about what these numbers are. The turn values are our working assumptions, not measured market data. No public source we found prices individual factors in turns. What the sources do give is direction:
- Quality is paid for. In GF Data’s 2024 private equity deals, companies with above-average financials (revenue growth and margins both above 10%) averaged 7.7× EBITDA versus 7.2× overall. That’s about half a turn (GF Data).
- Concentration and owner dependence are discounted. FE International notes that if one customer is 50% of revenue, a buyer “will heavily discount” the business. Undocumented owner dependency “will scare buyers” (FE International, Jan 2026).
- Buyers want acquisition they can repeat. Capstone’s e-commerce coverage says buyers favor low customer acquisition cost (CAC) and strong first-party data. Brand equity and profitability make the list too (Capstone Partners, Dec 2024).
For our example, growth (15%), gross margin (60%) and marketing spend (28%) all land in neutral bands. Repeat revenue sits at 20–40%, also neutral. Three levers cost a quarter turn each: one marketplace is 15–35% of revenue, the hero SKU is 35–60%, and the founder still owns a couple of critical functions. Net: −0.75 turns.
That takes the multiple to 3.25× low, 4.25× base, 5.25× high, and enterprise value to $7.15M, $9.35M and $11.55M.
The levers are also your to-do list. Say the same brand hands day-to-day work to a team (+0.25) and gets its books QoE-ready (+0.25). It also lifts repeat revenue into the 40–60% band (+0.5). The base multiple moves to 5.25×. That’s $11.55M instead of $9.35M: $2.2M more on the same EBITDA.
Step 4: Bridge enterprise value to cash at close
Enterprise value assumes the buyer takes the business cash-free and debt-free, with a normal level of working capital. Everything between that headline and the wire comes from the deal terms.
Here’s what each line is, and what’s typical:
- Working capital true-up. The deal sets a “peg”, usually the trailing-12-month average of normalized net working capital. If you deliver less on closing day, the price drops dollar for dollar (BDO). Our example delivers $100k under its $1.2M peg.
- Inventory. A normal level of inventory is usually inside the price, via working capital. Excess inventory is often bought separately, at cost (Website Closers). Overbuying stock before a sale doesn’t raise the multiple.
- Debt and debt-like items. Loans, open cash advances, unpaid taxes and gift-card balances get paid off from the proceeds. Our example carries $800k of financing and $150k of debt-like items.
- Earnout and seller note. Part of the price is paid later: an earnout only if targets are hit, a seller note as a loan to the buyer. In IBBA’s Q2 2026 survey, $5M–$50M deals averaged 83% cash at close, 6% seller financing, 7% earnout and 4% retained equity (IBBA). Our example uses those 7% and 6% figures.
- Escrow or holdback. Held back against claims and released later. It appeared in 88% of 2025 private-target deals, with a median of 10% of deal value when there was no reps-and-warranties insurance (SRS Acquiom via DealLawyers.com, Apr 2026). We use 10%.
- Rollover equity. In private equity deals, you may reinvest part of the price in the buyer’s company. GF Data found rollover in 63.6% of 2024 PE deals, averaging 14.5% of the price (GF Data). Our example has none.
- Fees. Advisor fees are often set on the Lehman scale (5% of the first $1M, then 4%, 3%, 2%, 1%) or “double Lehman” (10/8/6/4/2%) (Morgan & Westfield). We use 5% plus $150k of legal, accounting and QoE costs.
The result: $5.53M of cash at close before tax, 59% of enterprise value. Another $2.15M sits in escrow, the earnout and the seller note, and some of it may never arrive.
What about tax?
For 2026, the top federal long-term capital gains rate is 20%, which applies above $613,700 of taxable income for married couples filing jointly (IRS Rev. Proc. 2025-32). The 3.8% Net Investment Income Tax generally doesn’t apply to an active owner’s gain on an S-corp or partnership interest (IRS). Structure matters: in an asset sale, the price is split across asset classes, and the inventory portion is taxed as ordinary income (IRS Publication 544).
Our example applies a flat 20% federal estimate to cash at close, which leaves $4.43M. State tax would come on top. Treat this as a planning number and get the real one from your accountant, ideally a year before you sell.
Step 5: Price your financing in true APR
Most DTC brands carry some financing into a sale, often revenue-based advances or merchant cash advances (MCAs) priced as a flat fee or a factor rate. Financing costs sit below EBITDA, so they don’t change your multiple. But every open balance comes off the price at close, and expensive capital drains cash you could have used to grow EBITDA.
A flat fee hides the real cost because you start repaying almost immediately. The fix is to compute the APR from the actual repayment schedule. Find the periodic rate at which the payments equal the cash you received, then multiply by periods per year. That’s the actuarial method lenders use for APR disclosures. The calculator does it for daily, weekly or monthly repayment, or for a share of daily sales.
| Offer | Repayment | True APR |
|---|---|---|
| Shopify Capital example: 13% fixed fee | Evenly over 12 months | 24.9% |
| Same 13% fee | Evenly over 6 months | 49.7% |
| Wayflyer example: $4,200 fee on $100,000 | Evenly over 6 months | 16.5% |
| Fed’s MCA example: $50,000 for $65,000 of future receipts | Over about 6 months of business days | about 109% |
| SBA 7(a) loan over $350k, maximum rate | Amortizing term loan | 10.0% (prime 7.00% + 3%) |
| Bank term loan, Q1 2026 median | Amortizing term loan | 6.7–7.1% |
APRs for the fee examples are our calculations from published examples: Shopify, Wayflyer, Federal Reserve. Rate sources: SBA, FRED, Kansas City Fed.
The same 13% fee costs twice as much, in annual terms, when you repay it twice as fast. That’s why a fast sales month makes revenue-based financing more expensive, not less. Reviewing online lender sites, the Fed found MCA equivalent APRs that “may exceed 80 percent or even rise to triple digits.”
None of this makes fast capital wrong. If $500k of inventory sells through at a 60% gross margin in three months, a 50% APR can still pay. But price it against the alternatives before you sign, and plan to clear or refinance expensive balances well before a sale.
What to fix 12 to 24 months before you sell
Buyers price the last 12 months, so the work has to show up in the numbers before you go to market. In order of what we’d tackle first:
- Move to accrual books with a monthly close. It’s the cheapest lever and it protects every add-back you claim. Get a QoE-style review done on your own terms before a buyer does one on theirs.
- Document every add-back now. Keep the invoices, contracts and a one-line reason for each. Undocumented add-backs get cut in diligence.
- Grow repeat revenue. It’s the lever with the most upside in the calculator, and it improves EBITDA at the same time. Start with retention rate and cohort analysis to see where second purchases leak. Our five retention metrics are the ones we track daily.
- Cut paid-media dependence by improving efficiency, not by cutting spend blindly. Buyers will read your marketing efficiency ratio (MER) and contribution margin. Our e-commerce scaling scorecard shows what to check weekly.
- Take yourself out of daily operations. Hire or document the functions only you run, especially paid acquisition and supplier relationships.
- Reduce concentration where you can. Broaden the product mix around the hero SKU and keep any single marketplace or retailer from growing into a dependency.
- Clear or refinance expensive capital so you’re not carrying 50%+ APR balances into the sale.
- Manage working capital to the peg. Don’t run inventory down to flatter cash in the final months. It shows up as a shortfall against the peg and comes off the price.
Run your own numbers in the DTC Valuation Calculator. It’s free, ungated, and the defaults are the worked example above, so you can change one input at a time and watch what moves.
If you want help moving the levers themselves (retention, contribution margin and reporting you can defend in diligence), that’s what Finsi Growth does for DTC brands.
This guide is for planning. It isn’t legal, tax or investment advice, and the multiples are market averages, not a quote for your business.
Frequently Asked Questions
What multiple do DTC brands sell for?
It depends mostly on size. Website Closers’ ranges run from about 2.3–3.3× SDE for small e-commerce brands to 4.0–6.0× EBITDA at $1M–$3M of EBITDA and 5.5–7.5× at $3M–$10M. IBBA’s Q2 2026 survey found 4.0× for $2M–$5M deals and 5.8× for $5M–$50M deals, across all industries.
Should I use SDE or EBITDA?
If your business has under about $1M of earnings and you run it day to day, buyers will usually price on SDE, which adds back all owner pay. Above that, private equity and strategic buyers price on adjusted EBITDA, where a market-rate manager’s salary stays in costs.
Why is cash at close so much lower than the sale price?
Because enterprise value assumes a debt-free business with normal working capital, and part of the price is often deferred. Debt payoff, working capital true-ups, fees, escrow, earnouts, seller notes and rollover equity all sit between the headline and the wire. In our worked example, cash at close is 59% of enterprise value before tax.
Does inventory add to my valuation?
Usually not on top of the multiple. A normal level of inventory is part of working capital and is included in the price. Excess inventory may be bought separately at cost, but that’s a negotiation, not a bonus. Running inventory below the agreed peg reduces the price.
How do I convert a factor rate to an APR?
Find the periodic interest rate at which your scheduled payments equal the cash you received, then multiply by the number of payments per year. In a spreadsheet, that’s =RATE(n, -payment, cash_received) × periods_per_year. Paste your offer into the calculator’s cost-of-capital tab to get the same result from daily sales remittance.