The weekly report most DTC brands send is a page of numbers with arrows next to them. People skim it, notice something red, ask “why did this drop?”, and move on. Nothing changes, because the report never said whether the move mattered or what to do about it.
A report people act on does four things differently. It shows every metric against a target and its own normal range. It splits blended totals so one channel can’t hide another. It ends with no more than three actions, each with an owner. And anything urgent skips the report entirely and arrives as an alert. Here’s how to build that, using what operators told us on our client and discovery calls between late 2025 and May 2026.
Key Takeaways
- Long reports go unread. Operators repeatedly told us they read only the summary, or want a table, not paragraphs.
- A number without a target and a baseline invites overreaction. Show each metric’s normal weekly range, from your own history, not industry averages.
- Blended totals hide failures. In one case we saw, a record marketplace month masked web sales falling from $240k to $132k year over year.
- End every report with at most three actions, each with an owner, an expected impact and the number that will confirm it.
- Things that break need alerts, not report lines. A code that expired mid-campaign took one brand’s CAC from $7 to $23 overnight.
Why do long reports get ignored?
Because the reader has five minutes, and the report asks for thirty. The operators we talk to aren’t short on data. They’re short on attention, and a long document makes them do the analysis themselves.
We heard the same thing from brands of every size:
- A tea brand’s leadership “would probably read just the executive summary.”
- A frozen-food founder: “I don’t read long documents anymore… tables are easier.”
- An operator at a DTC brand moving into retail: “I keep getting big sheets of text… I’m just trying to read less.”
- An apparel founder, looking at a long sample report: “I don’t know if I’d ever read that.”
Meanwhile someone spends real time building it. A subscription growth lead told us they write the Monday report by hand, 30 to 60 minutes a week, longer in a down week. A supplement brand fills a KPI document by 9am every day. Another operator estimated a proper version would take “a full workday.”
So you pay for the report twice: once to build it, and again when nobody acts on it. Fixing the format is cheaper than either.
Rule 1: Show every metric against a target, not just against last week
A report line should say whether the number is on track, not just whether it went up. “Revenue down 6% week over week” tells you nothing. “Revenue $41k, target $45k, inside normal range” tells you to keep moving.
The target has to be the right kind, too. A skincare brand asked us to change a report’s default goal from 20% month-over-month growth to a year-over-year target. Month-over-month goals make every seasonal dip look like a failure. For a seasonal business, year over year is the honest comparison.
Keep the metric list short. A consumer-product founder told us she wants 10 to 12 metrics, shown visually, each with a 4-week and a year-over-year view. That’s a good ceiling. If a metric hasn’t changed a decision in three months, drop it from the report and keep it in the dashboard.
Two metrics deserve a permanent slot. A natural-soap founder told us only two KPIs survive every experiment: revenue growth and contribution margin. Everything else is supporting detail.
Rule 2: Give each metric its own baseline
Every metric needs a normal range built from its own recent history, so the reader can tell noise from signal. Without one, people react to every wiggle.
A men’s grooming brand told us its executives “take the bait” on noisy weekly metrics. A mystery-box CFO showed us the opposite failure. His daily report said “you spent $90 less than you normally spend.” His reaction: “I don’t know what to do with that data.” Both problems have the same fix. Show the normal band, and flag only what falls outside it.
How to build a simple baseline:
Normal range = trailing 8-week median ± the typical week-to-week swing for that metric
Use your own history, not industry benchmarks. We’ve told clients that market benchmarks are “very average.” On a call with a tea brand, the comparison came out sharper: an industry churn figure is the “average temperature in the hospital.”
Then protect the baseline from your own changes. When you change the site, a price or an offer, the baseline shifts, and the next few weeks of ad results get misread. We now ask every client to tell us about site changes for exactly that reason. Keep a one-line change log at the bottom of the report. A fertility-device brand told us it wished it had a timeline of which messaging ran in which month, so it could explain past spikes.
| Metric | Bad report line | Good report line |
|---|---|---|
| Revenue | Down 6% WoW | $41k vs $45k target, inside normal range |
| CAC | $52 | $52 vs $45 target, above range 2 weeks running |
| Repeat rate | 18% | 18%, same as this cohort age last year |
| Email revenue | Up 22% | Up 22%, mostly a promo send; flows flat |
Rule 3: Split blended numbers before they hide something
A blended total can look healthy while one channel inside it collapses. Reports should show the totals and the channel lines underneath them.
The clearest example came from an omnichannel nutrition retailer. Its June 2025 web sales were $132k, against $240k a year earlier. The total looked fine, because a record $163k marketplace month landed at the same time.
The founder’s line stuck with us: “the holy grail for me is figuring out when we have a good month or bad month, why did that happen.” You can’t answer that from a blended number.
The same masking shows up inside DTC. In subscription reports we’ve built, recurring billing revenue has hidden a drop in new-customer acquisition more than once. Renewals keep the top line steady while the pipeline behind them dries up. A men’s grooming brand saw new-customer share of revenue fall from 50% to about 25% over 12 to 18 months. “I wish I would have been more on top of it twelve months ago,” one of its leaders told us.
Three splits to put in every report:
- New vs returning revenue. Separate first orders from repeat and subscription renewals.
- Revenue by channel or storefront. Web, marketplaces and retail each get their own line, month over month and year over year.
- LTV by acquisition source. A former head of user acquisition at a large subscription brand told us a separate LTV row per traffic source “makes the fights disappear.” Channel owners stop arguing about credit when they see what their customers are worth.
And define revenue once. A large bedding brand told us its metric definitions drift: revenue with or without tax, shipping and returns. Write the definition into the report footer. If your platforms disagree with Shopify, fix that first. Our platform revenue vs Shopify reconciliation guide walks through it.
Rule 4: End with three actions, not thirty
Every report should close with at most three actions, each with an owner, a reason in numbers and the metric that will confirm it. A report that ends in a list of twenty ideas has just moved the work to the reader.
This is the most consistent request we hear. A large beach-bag brand: “Data is useless unless it’s actionable.” An organic-foods brand: “The risk is you create work that you can’t execute.” A supplement brand that tried daily recommendations found three tasks a day took about 1.5 hours, which is more than most small teams can spare. We made the case for capping active work at two priorities in two priorities, not twenty dashboards. The report is where that cap gets enforced.
What a usable action looks like:
| Field | Example |
|---|---|
| Action | Move the subscription offer email from day 20 to day 25 |
| Why, in numbers | 30% of buyers who subscribe do it around day 25 |
| Owner | Retention lead |
| Expected impact | A conservative range, not a single big number |
| Confirm with | Subscription conversion of that cohort, 4 weeks out |
The example comes from a body-care brand’s head of retention. She had found that buyers converted to subscription around day 25, but the subscription email went out on day 20. That’s the shape of a good action: a specific change, tied to a number the reader can check.
A few rules for writing them:
- Explain with numbers. An antiperspirant brand asked for recommendations made the way a consultant would: “make the recommendation and explain with numbers why it makes sense.”
- Keep impact estimates modest. A tea brand founder reacted to a large projected gain with: “Do I really think we’re gonna make $2.5M from those changes? No.” One inflated estimate costs credibility for every action after it.
- Use plain language. The same body-care retention lead asked for “first-grader” language instead of headline-style copy.
- Match the cadence to the metric. A coffee brand pointed out that a daily “do this today” is overkill for email, which needs three to four weeks to read. Weekly actions for ads, monthly for retention flows and cohorts.
- Track what shipped. A supplement brand asked for a running list of what the team did and what it changed. Without it, nobody knows which actions worked.
- Let readers park things. The skincare brand also asked whether reports could ignore areas it had chosen not to fix. They should. A deliberate “not now” is a decision, not a gap.
Rule 5: Turn urgent problems into alerts, not report lines
Anything that needs action the same day shouldn’t wait for Monday’s report. Alerts are for things that break. Reports are for things that drift.
The costs of missing a break are real:
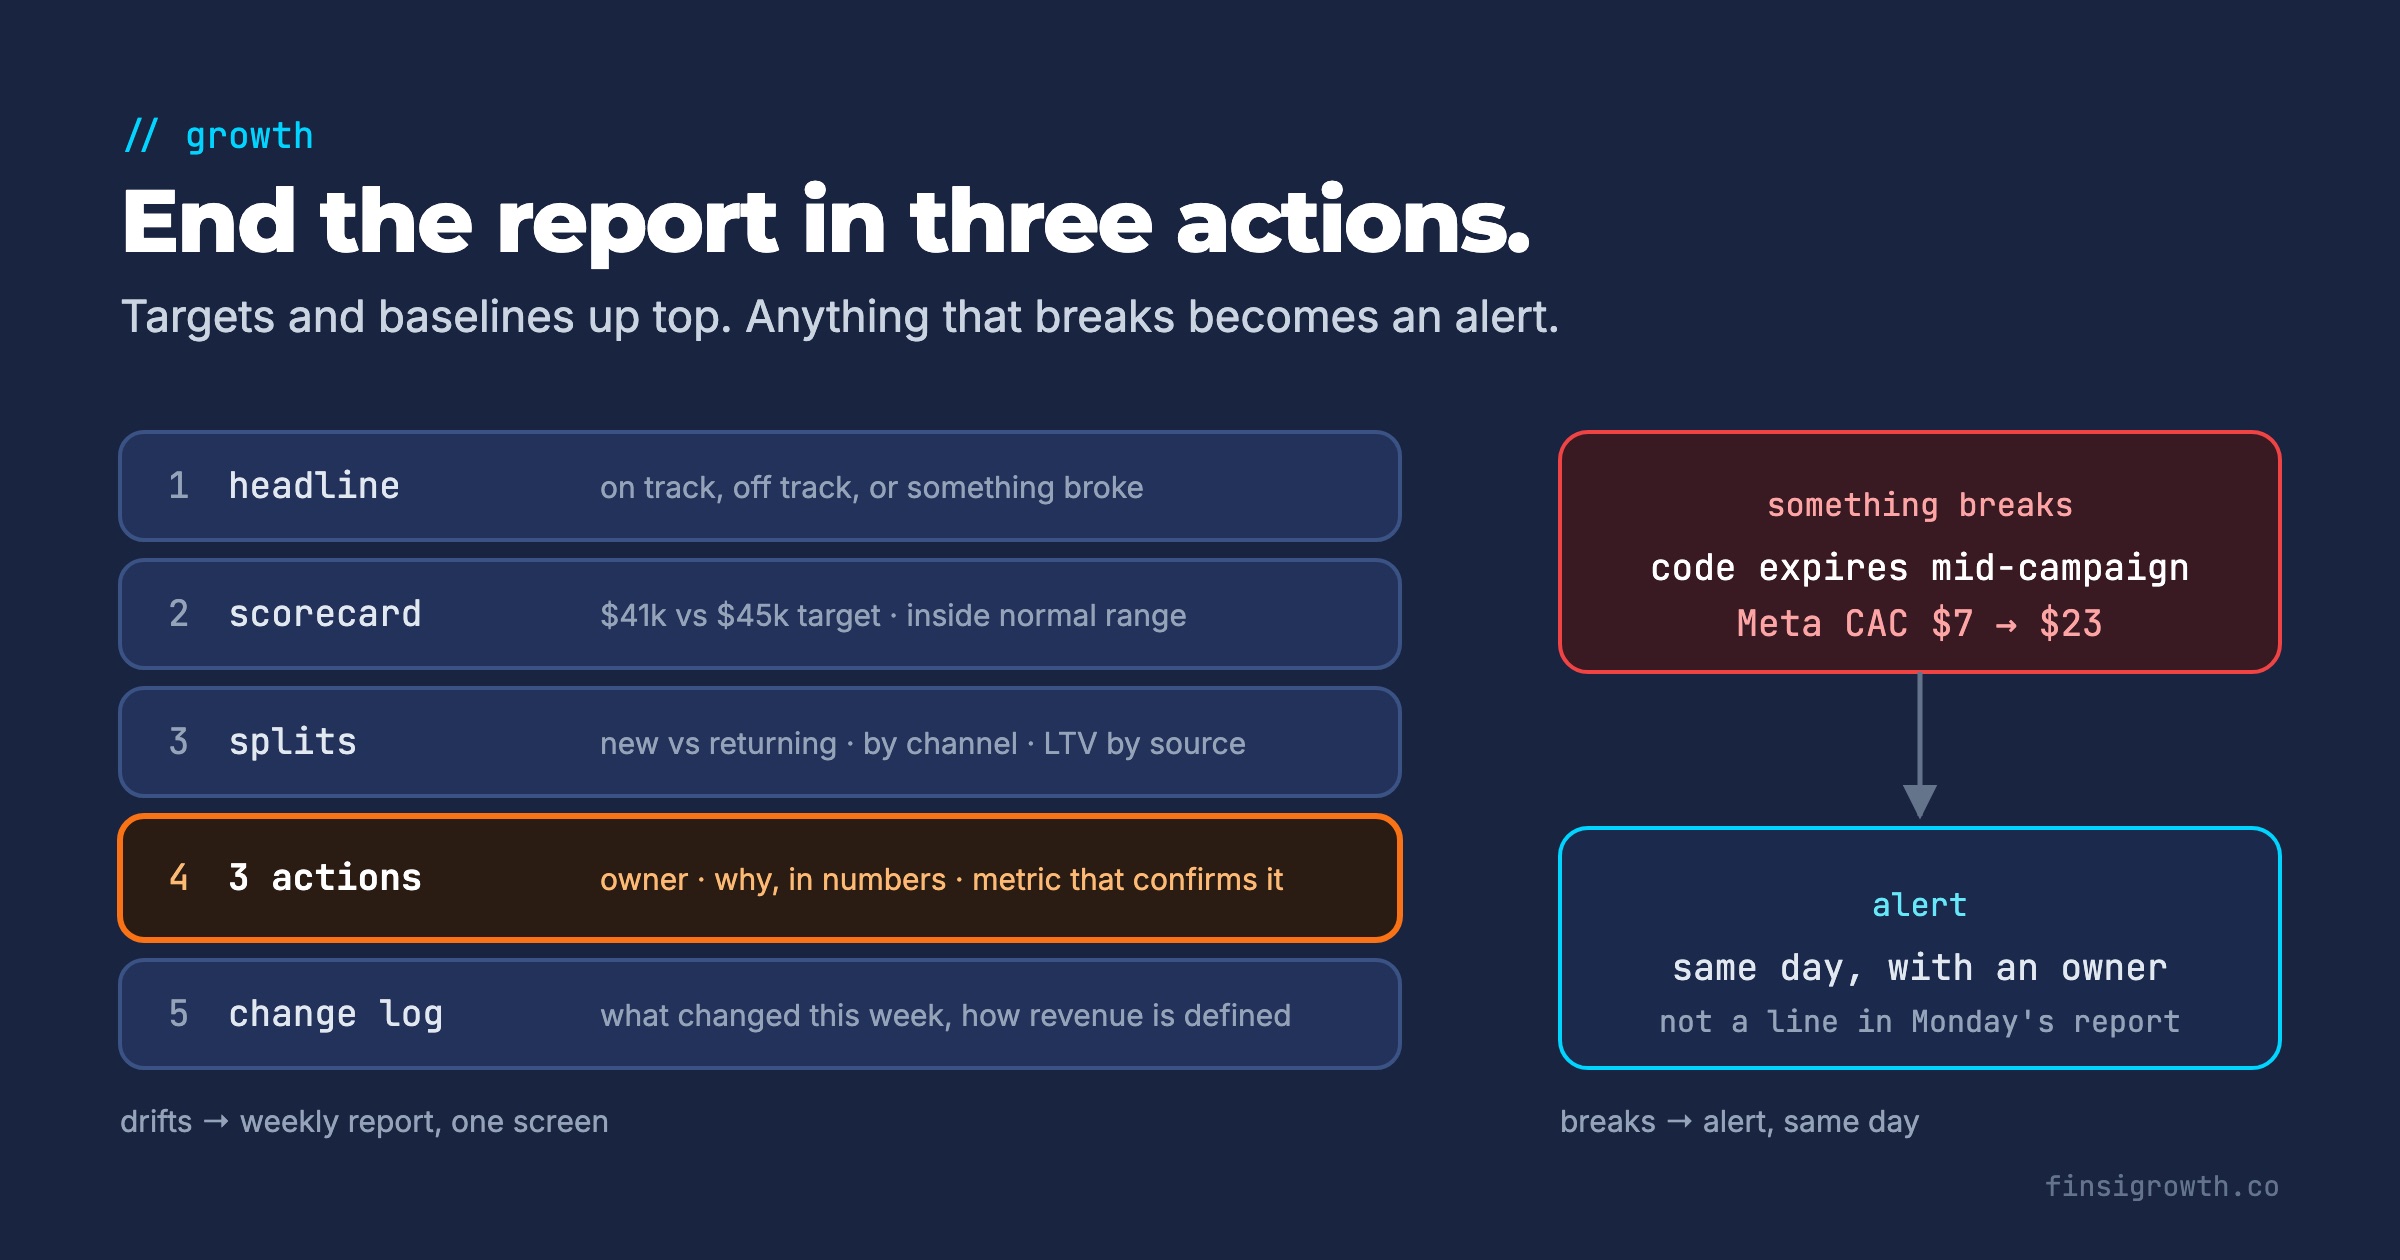
- A history-subscription brand’s agency let a Father’s Day discount code expire while the ads kept running. Meta CAC went from $7 to $23 overnight, and the agency’s monthly report didn’t mention it.
- A pet subscription brand’s dashboard showed its welcome flow sending zero emails, while other reports showed about 300.
- The nutrition retailer from Rule 3 had flows switched off during a platform migration.
- A retention director at a subscription coffee brand starts every day with a flow-traffic view for exactly this reason. A backed-up trigger shows up as a day of zero sends, then a spike.
Alerts also catch the changes people forget to mention. At an edibles brand, the marketing team halved ad spend for an incrementality test without telling the e-commerce lead. The daily alert caught it. Client results are specific outcomes, not typical or guaranteed.
| Alert | Trigger | First check | Owner |
|---|---|---|---|
| Spend change | Daily spend ±30% vs 7-day average | Budget edits, paused campaigns | Paid lead |
| CAC spike | Daily CAC above 1.5× target with meaningful spend | Expired codes, broken landing page, checkout | Paid lead |
| Flow stopped | Any core flow at zero sends for 24 hours | Trigger, list, integration status | Retention lead |
| Orders drop | Daily orders below the normal range 2 days running | Site uptime, checkout, payment provider | Founder or e-com lead |
| Revenue mismatch | Platform-reported revenue far above Shopify | Duplicate events, attribution windows | Whoever owns the report |
Tune the thresholds to your own volatility. Small accounts swing more, so start wide and tighten once false alarms stop.
Choose alert metrics that measure behavior. Don’t alert on email open rates. Apple announced Mail Privacy Protection in June 2021. It “helps users prevent senders from knowing when they open an email,” so opens are unreliable for anyone reading in Apple Mail. Alert on clicks, orders and sends instead. If flows go quiet without warning, our post on silent Klaviyo flow failures covers the checks.
What does the finished report look like?
One screen, five blocks, in this order:
- Headline. One sentence: on track, off track, or something broke. Readers who stop here should still know the state of the business.
- Scorecard. 10 to 12 metrics, each with target, normal range, 4-week trend and year-over-year.
- Splits. New vs returning, by channel, LTV by source.
- Three actions. Owner, reason in numbers, expected range, confirming metric.
- Change log and definitions. What changed this week, and how revenue is defined.
Everything else, from creative breakdowns to email-by-email stats, belongs in the dashboard behind the report. That’s where you go when an alert or a scorecard line tells you to look.
What to do this week
- Cut the metric list. List every metric in your current report. Keep the 10 to 12 that changed a decision in the last quarter, plus revenue and contribution margin.
- Add a target and a range to each. Set the target from your plan. Compute the normal range from the last eight weeks of your own data.
- Switch seasonal comparisons to year over year. Keep week-over-week only for metrics that don’t swing with the calendar.
- Add three splits. New vs returning revenue, revenue by channel, and LTV by acquisition source.
- Write the action block. End this week’s report with no more than three actions. Each one gets an owner, a reason in numbers and a confirming metric.
- Set up two alerts. Start with the two most likely to save money: a core flow at zero sends, and daily spend or CAC outside its range.
- Start a change log. One line per site, price, offer or budget change, dated. It will explain your next “why did this drop?” before anyone asks.
Frequently Asked Questions
How often should the report go out?
Weekly for most brands, with a short monthly version for budget and retention decisions. Daily reports work only as alerts. Retention metrics need weeks to show a result, so judging them daily mostly shows noise.
Who should write the three actions?
Whoever owns the result, not whoever pulls the data. If an agency writes the report, ask it to propose the actions with the numbers behind them. Then the owner on your side approves or parks each one.
Should we include benchmarks from other brands?
Sparingly. Your own history is the baseline that matters for alerts and ranges. Outside benchmarks are useful once a year, when you’re setting targets, not every week.
Report less, decide more
A report’s job isn’t to show everything you measured. It’s to tell the reader what’s on track, what isn’t and what happens next. Keep the targets, the baselines and the three actions on one screen. Let alerts handle what breaks. People will read the report again, because it finally tells them something they can use.