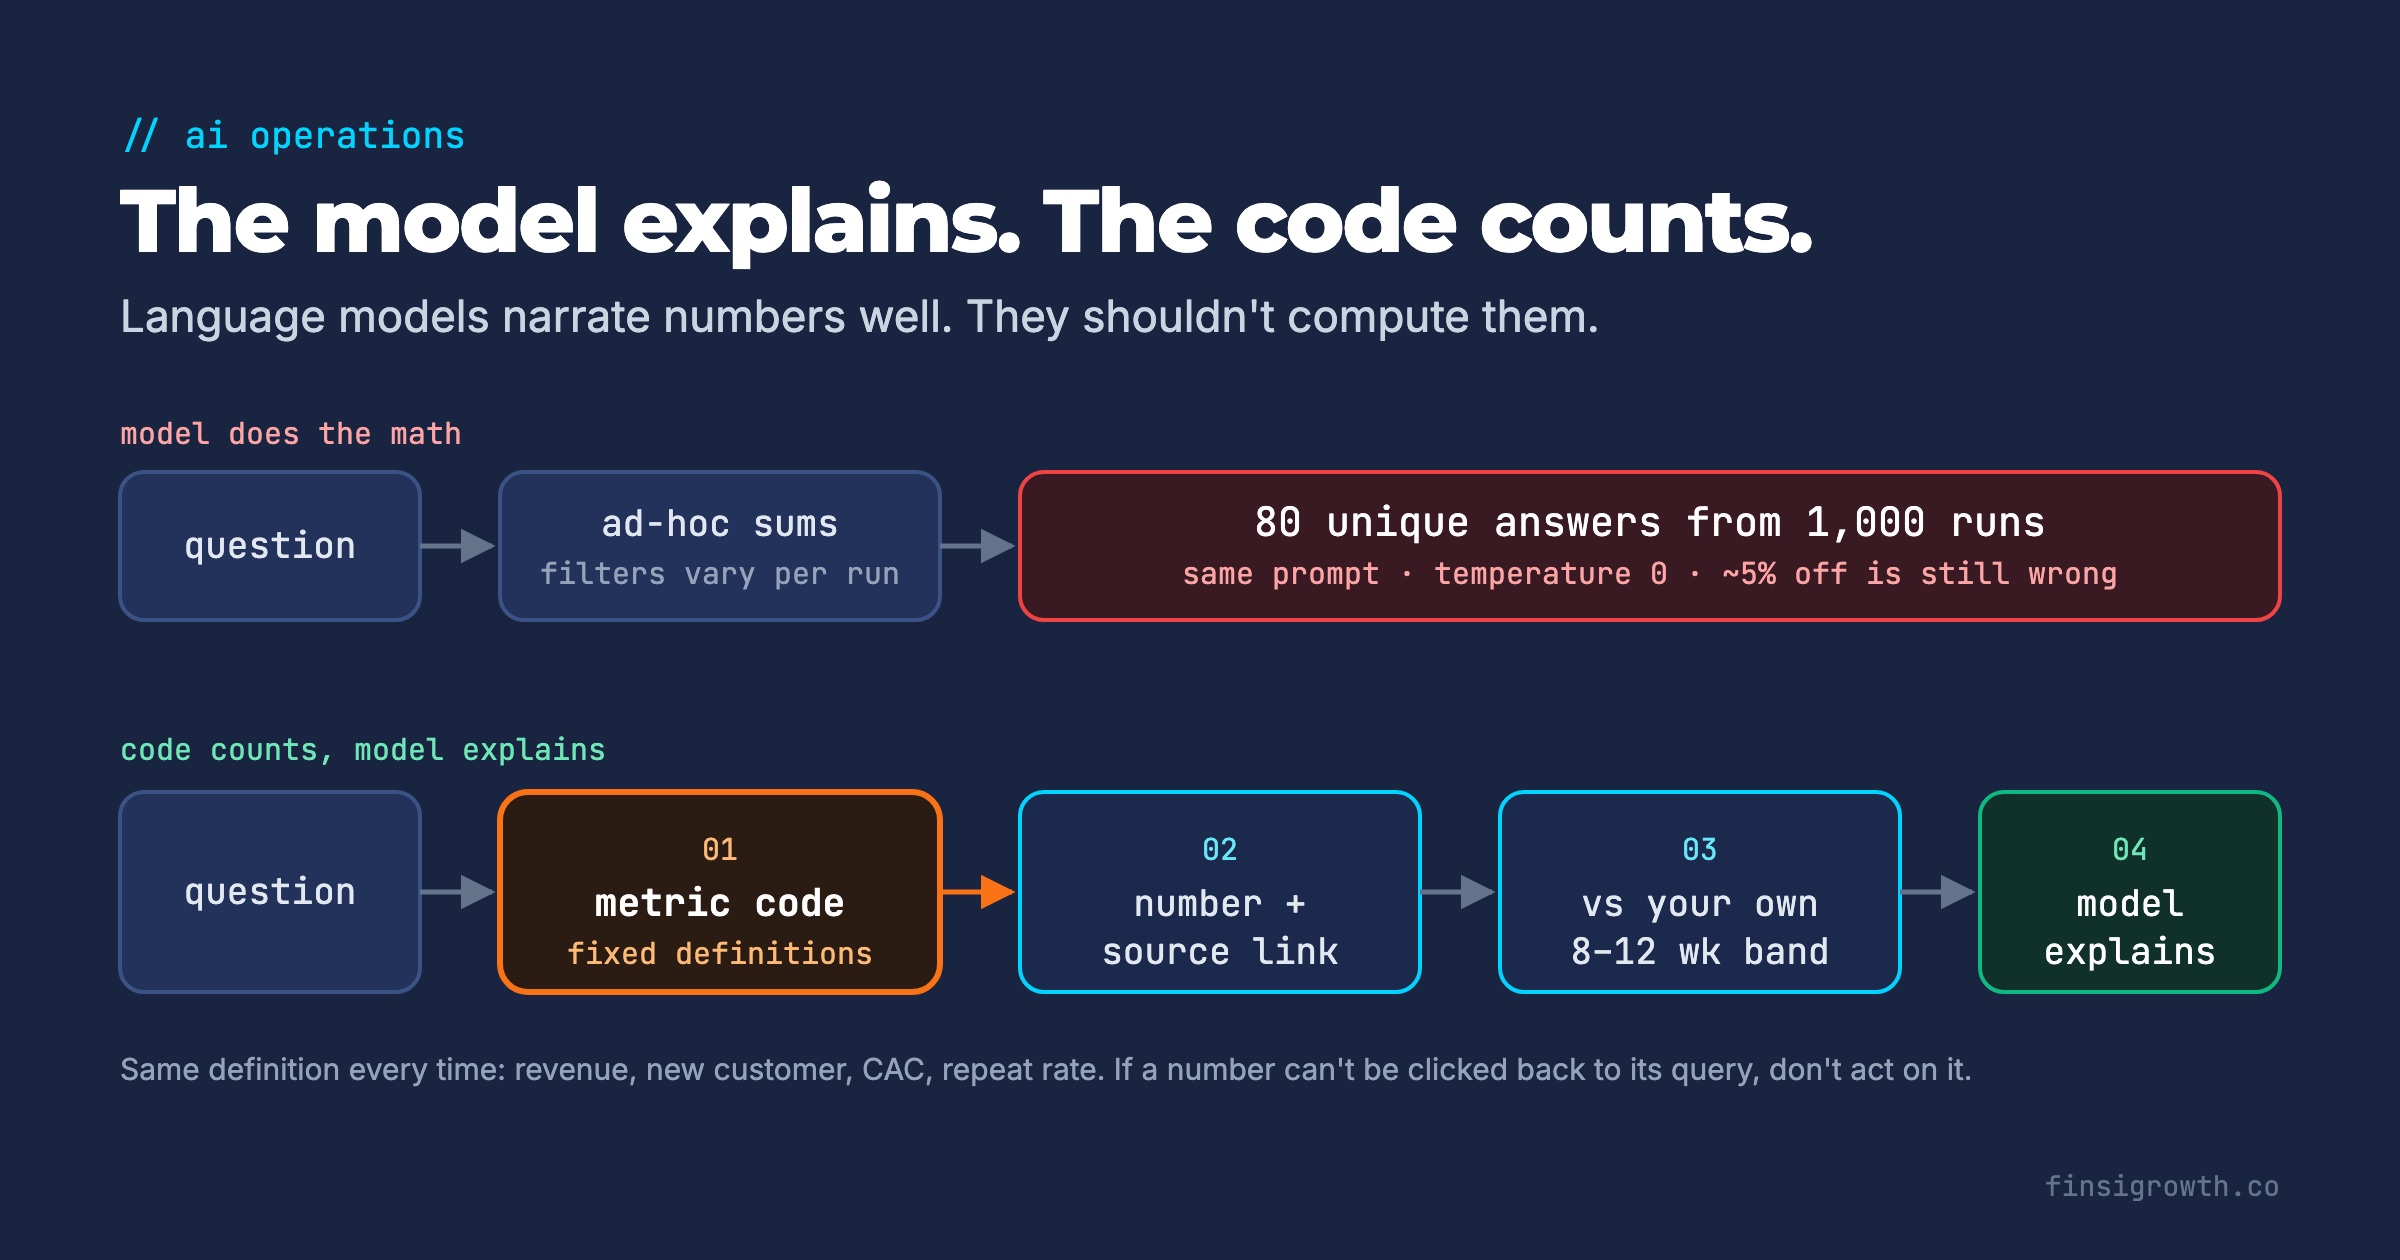
Most AI analytics tools fail the same way. You ask a question, get a confident answer with a precise number, and then ask again and get a different one. After the second or third time, nobody on the team uses it. The tool didn’t fail because AI is useless. It failed because the AI was doing the math.
Four things make AI analysis trustworthy. Metrics are calculated in code before the model sees them. Every number is compared against your own history. Every claim links back to source data. And the tool has a track record on questions you already know the answers to. We’ve heard this checklist, in different words, on dozens of client and discovery calls over the last six months.
Key Takeaways
- Language models aren’t calculators. Even at temperature 0, one lab got 80 different completions from 1,000 runs of the same prompt.
- Metric definitions (revenue, new customer, CAC) should live in code, computed the same way every time. The AI should explain numbers, not produce them.
- Compare every metric to your own history, not to industry averages. A change inside normal weekly noise isn’t news.
- Every number in an AI report should link to the query or export it came from. If you can’t click it, don’t act on it.
- Before you trust a tool, make it re-answer past questions you already know the answers to. Track its error rate for two to four weeks.
Why does AI analysis give a different number every time?
Because a language model generates text, and a number is just more text. When you hand a model a raw export and ask “what was our ROAS last month?”, it decides how to filter, sum and divide on the fly. It can make a different choice on the next run.
One operator put it plainly on a January call: models “run the math different ways each time.” His conclusion was “trust but verify.” Another growth lead told us the single thing she wanted from an AI tool was “consistency.”
This isn’t only about the model choosing different methods. Output itself varies. In a September 2025 experiment, Thinking Machines Lab sampled the same prompt 1,000 times at temperature 0, the setting most people assume is deterministic. They got 80 unique completions (Thinking Machines Lab, Defeating Nondeterminism in LLM Inference, September 2025). Their fix required changes deep in the inference stack, which no analytics vendor’s chat box gives you.
So the question isn’t whether the model will drift. It will. The question is whether your numbers depend on it.
What do confident wrong numbers look like in practice?
They rarely look like errors. They look like insights. Here’s what operators described to us between October 2025 and March 2026, grouped by failure mode.
| Failure mode | What operators saw | Why it happens |
|---|---|---|
| Invented metric | ”Revenue performance 90%” reported from a single conversion | Model computes a ratio on a tiny denominator and presents it as a trend |
| Wrong data | Insights that were “fundamentally wrong because it was analyzing the wrong data” | Model picks the wrong table, date range or field |
| Close but wrong | Numbers about 5% off the real figure. “Still 5% is too far.” | Ad-hoc sums with different filters, refunds or time zones |
| Made-up story | An AI agent that fed a sales team invented metrics and explanations for six months | No check between generated text and source data |
| Generic advice | One founder’s estimate of a built-in AI tool: half hallucination, a quarter generic advice, a fifth to a quarter usable | Model fills gaps with blog-post marketing wisdom |
| Overdramatic framing | A report calling a fulfillment delay a “crisis.” The client: “Everything’s a crisis.” | No sense of scale for this business |
The “close but wrong” row deserves attention. A 5% miss sounds small. But finance teams reconcile to the penny, and one wrong number poisons every right one next to it. An operator at a home-appliance brand told us a single penny off is enough to make them stop trusting a report.
The pattern across all six rows is the same. The tool was asked to do arithmetic, pick data and supply context in one step, and it got at least one of the three wrong.
1. Put metric definitions in code, not in the prompt
The fix with the biggest effect is also the least exciting. Calculate every metric with fixed, written definitions before any model touches the data. Then hand the model the finished numbers and ask it to explain them.
That’s how we build analysis for the brands we work with. The metric engine is ordinary code, the same formula every run. The AI reads the computed metrics and writes the explanation. As we tell prospects on calls, the AI “doesn’t do any calculation.” It isn’t good at math, and it doesn’t need to be.
Definitions matter more than most teams think. On calls, we’ve heard about:
- A retention lead with “three different tools that measure LTV,” each giving a different answer.
- A beverage brand where Meta-reported customers sometimes exceeded the total customers the business acquired that day.
- An operations team for whom Shopify, NetSuite and the warehouse system matching was a “rare day.”
If your tools don’t agree on a definition, an AI reading all three will pick one at random. Write the definitions down once. A starting set:
| Metric | Pin down |
|---|---|
| Revenue | Gross or net revenue? Before or after refunds, tax, shipping and discounts? |
| New customer | First order ever in Shopify, matched by email or customer ID, not “new” per ad platform |
| CAC | Which spend (all paid media, or paid plus agency fees) divided by which new-customer count |
| Repeat rate | Window (60, 90 or 180 days) and whether subscription renewals count |
| Conversion rate | Sessions from which source, orders including or excluding subscriptions |
If you already reconcile platform revenue against Shopify, you’ve done half of this work. Our guide to reconciling platform revenue with Shopify covers the mechanics.
The decision for this section: if a tool lets the model query raw data and do the math itself, treat every number it gives you as a draft.
2. Compare every number to your own baseline
A number without a baseline is trivia. A finance lead at a subscription box brand described the daily reports his previous tool sent: “you spent $90 less than you normally spend.” His reply on the call: “I don’t know what to do with that data.” The marketing team got the same report.
The opposite problem is just as costly. A growth lead at an omnichannel grooming brand told us executives “take the bait” on noisy weekly metrics. Every dip triggers a meeting. That’s why each metric needs its own normal range.
Industry benchmarks don’t solve this. On a February call, we put it bluntly: market benchmarks are “very average,” and the only useful comparison is your own history. A brand with a 45-day reorder cycle and a brand with a 120-day cycle shouldn’t share a “good” repeat rate.
A workable baseline rule:
- For each metric, take the last 8 to 12 weeks of weekly values.
- Record the median and the normal high and low (for example, the second-highest and second-lowest weeks).
- Flag a metric only when this week falls outside that band, or moves the same direction three weeks running.
- Exclude or annotate weeks with known events: a sale, a launch, a stockout, an influencer post.
Point 4 is where AI tools usually break. Operators asked us how an AI would know about sale periods, influencer events and planned campaign changes. One growth lead asked how to tell the AI that 100 units arrived spoiled, so it would know why a week looked bad. The answer is a simple events log, one line per event with a date, which the tool reads alongside the metrics.
For which metrics deserve a baseline first, see the five retention metrics we track. For cutting the list down to what leadership actually reads, see two priorities, not twenty dashboards.
3. Make every number cite its source
A skincare operator told us exactly what they needed before they’d act on an AI report: “link out to the underlying data.” A breakfast food brand’s team asked for footnotes and citations on every number. They’d already built an internal chatbot on their product reviews and learned the habit the hard way: “double check the citation.”
Citations do two jobs. They let you verify a number in ten seconds instead of rebuilding it. And they force the tool to be honest about where a number came from. A claim with no source attached is a claim the model may have generated.
What a good citation looks like:
- The metric name and its written definition.
- The date range and any filters (channel, product, customer type).
- A link to the saved query, dashboard tile or raw export.
- For a recommendation, the specific numbers it’s based on.
That last point came up repeatedly. A personal-care founder said to treat AI like a human consultant: “make the recommendation and explain with numbers why it makes sense.” Another operator said mistrust starts when “everything’s automated… you just read off a list.”
Add automatic sanity checks too. Some numbers are implausible or impossible: a 15% conversion rate on paid social, more Meta customers than total new customers, a cohort bigger than its orders. Those should block a report, not decorate it. We run checks like these before anything reaches a human reviewer. We switched one model off entirely because it kept inventing marketing campaigns that never ran.
4. Give the tool a track record before you trust it
Trust is earned on questions where you already know the answer. Two operators we spoke to in January ran any new AI tool side by side with their own numbers for one to two weeks first. A PE-backed beauty brand’s operator said he’d keep checking until there were no meaningful errors. Another subscription operator simply said he wanted a “track record.”
The most rigorous version we’ve heard came from an analytics director at a large apparel brand in March. His team’s AI pilot had to pass 90% accuracy, tested by re-answering six months of past business questions with known answers. That’s a test any brand can copy at small scale.
Corrections are part of the track record. A subscription operator asked whether the AI could learn from his corrections after it raised a false alarm about a shipping integration. If a tool can’t take a correction and stop repeating the mistake, you’re the one doing the analysis.
There’s one more trap: the team asking bad questions. A baby-products brand cancelled a built-in AI analytics rollout because the team kept getting “non-answers.” The questions were vague, so the answers were vague. Good tools push back with a clarifying question or a narrower answer, not a long paragraph.
How do you test an AI analytics tool before buying it?
Run it against questions you’ve already answered by hand. Use this scorecard and give the tool a pass or fail on each line.
| Test | How to run it | Pass condition |
|---|---|---|
| Consistency | Ask the same metric question three times, in three sessions | Identical number every time |
| Definition | Ask how it defines revenue, new customer and CAC | Written definition matches yours |
| Reconciliation | Ask for last month’s revenue and new customers | Matches Shopify within your tolerance (ideally exact) |
| Citation | Ask where a number came from | Links to the query, tile or export |
| Small numbers | Ask about a campaign with under 10 conversions | Says the sample is too small, doesn’t compute a “trend” |
| Baseline | Ask whether a recent drop is unusual | Compares to your own last 8–12 weeks |
| Context | Ask about a week with a known sale or stockout | Uses your events log or asks what happened |
| Track record | Re-ask 10 past questions with known answers | 9 or more correct |
If a tool fails the consistency test, stop there. Every other result is unreliable.
What to do this week
- Write your definitions. One page: revenue, new customer, CAC, repeat rate, conversion rate. Get your finance lead to sign off.
- Run the consistency test. Ask whatever AI tool you use the same revenue question three times in fresh sessions. Note whether the number changes.
- Pull 10 known answers. Last month’s revenue, new customers, repeat rate, top product and a few others. Score your tool against them.
- Start an events log. A shared sheet with date, event and expected effect. Backfill the last 12 weeks of sales, launches and stockouts.
- Set baselines for five metrics. Median plus normal range over 8–12 weeks. Only discuss a metric when it leaves its band.
- Require a source on every number. If a report line can’t link to data, it doesn’t go in the weekly meeting.
The model explains. The code counts.
The operators we talk to aren’t against AI. Several have built their own assistants and agents. What they reject is a confident number they can’t check. Fixed definitions, your own baselines, citations and a track record turn AI from a guessing machine into an analyst you can work with.
If you want this built on your own data, with deterministic metrics and a human reviewing every report, that’s part of what Finsi Growth does for DTC brands. And if you want the account-level view to point it at, start with our e-commerce scaling scorecard.