Klaviyo’s Behind the Brands 2026 Edition profiles 11 brands, from Dollar Shave Club and Tatcha to a Texas arcade bar and a New England fish shop. Each case comes with a big red number: 144%, 70%, 221%, 123X.
It’s a vendor document, so read it like one. Most of those numbers are Klaviyo-attributed revenue, which isn’t the same as revenue Klaviyo created. But under the marketing there are real operating decisions, and several are worth stealing this week.
Here’s how we’d separate the two.
Key Takeaways
- Of the 11 brands, 5 started from a fragmented stack: email, SMS, POS or support in separate tools. The first win in most cases was data the team trusted, not a clever flow.
- The most transferable tactics are RFM-based offers (rewards for champions, discounts only for at-risk), win-back triggers tied to real purchase cadence, and channel-preference routing.
- New West KnifeWorks got 15% of one sale’s campaign revenue from its “Inactive” segment. Some customers came back after 3+ years. Don’t sunset lapsed buyers by default; test them.
- Share-of-revenue stats in the report range from 19% to 70% “from Klaviyo.” That spread reflects attribution settings and business model, not how good each program is.
- At Harney & Sons, a Finsi client, routing survey complaints into Klaviyo Help Desk tickets put support data to work for retention. You can do that before buying any AI agent.
- Judge your own retention program with holdout groups and cohort repeat rates, not attributed revenue.
How should you read a vendor case study?
Sort every number into one of three buckets before you believe it. Most of the confusion comes from treating all three the same way.
- Attributed share or growth. “47% of ecommerce revenue from Klaviyo,” “93% QoQ growth in flow revenue.” These count orders that happened after a message, inside an attribution window. Many of those customers would have bought anyway.
- Activity metrics. “144% increase in campaigns executed,” “40K+ self-service interactions.” These show the team moved faster. They don’t show profit.
- Operational outcomes. “84% of product recommendation chats resolved without a human,” “25% faster ticket resolution.” These are closer to cause and effect, because nothing else would have produced them.
Here’s the whole report sorted that way:
| Brand | Tactic | Headline stat | What kind of number |
|---|---|---|---|
| Dollar Shave Club | RFM segmentation | 144% more campaigns executed | Activity |
| Tatcha | AI timing of SMS sign-up forms | 70% YoY flow revenue growth during sale; 47% of ecom revenue from Klaviyo | Attributed |
| Corkcicle | Channel affinity (email vs SMS) | 93% QoQ flow revenue growth, first full quarter on Klaviyo SMS | Attributed |
| MESHKI | Dynamic product feeds | 19% of global ecom revenue; “123X ROI” | Attributed |
| Ministry of Supply | AI customer agent | 84% of product recs and 75% of “where’s my order” chats resolved | Operational |
| Thirdlove | On-site customer hub | $200K+ revenue, 40K+ self-service interactions in 2025 | Attributed + activity |
| Svenfish | Segments built from text prompts | 70% of YTD ecom revenue attributed | Attributed |
| Cidercade | Win-back flows | 221% growth in automation revenue over 2 months | Attributed |
| New West KnifeWorks | RFM, incl. inactive segment | 31% YoY growth in customers converted | Outcome, but not isolated |
| Naturium | Cohort analysis of loyalty | 169% QoQ growth in point redemptions | Activity |
| Harney & Sons | AI agent + helpdesk | 77% of rec queries resolved; 25% faster resolution | Operational |
Source: Klaviyo, Behind the Brands 2026 Edition (AMER). All figures are self-reported by Klaviyo and its customers.
None of this means the programs didn’t work. It means the report can’t tell you how much they worked. That’s your job, and we’ll come back to how.
Why did most of these brands start by consolidating data?
Because they couldn’t act on data they didn’t trust. Five of the 11 cases open with the same problem: email in one tool, SMS or POS or support in another, and numbers that didn’t match.
- Dollar Shave Club said pulling new customer data for segmentation could take a month or more. Developers were involved in “every single part of the email process.”
- Corkcicle and MESHKI ran email and SMS in different platforms, so nobody could manage cadence across both.
- Cidercade’s HubSpot data routinely disagreed with its Square POS. CEO Joel Malone: “We were never confident our data was right.”
- Harney & Sons needed custom developer work just to add wishlist or subscription tabs to account pages.
The Cidercade detail is the one to remember. Its old win-back campaign targeted people who hadn’t visited in six months. Then staff noticed regulars were redeeming the win-back codes. That’s not a CRM problem. It’s a margin leak: discounts paid to customers who were coming back anyway.
The decision for you: before building any new flow, pick 20 recent customers. Check that their order count, last order date and channel consent match across Shopify, your ESP and your SMS tool. If they don’t, fix that first. Every segment you build on top inherits the error.
Which RFM tactics are actually worth copying?
The ones that change who gets the discount. RFM sorts customers by recency, frequency and monetary value, then groups them: champions, loyal, needs attention, at risk, inactive. Two brands in the report used it well.
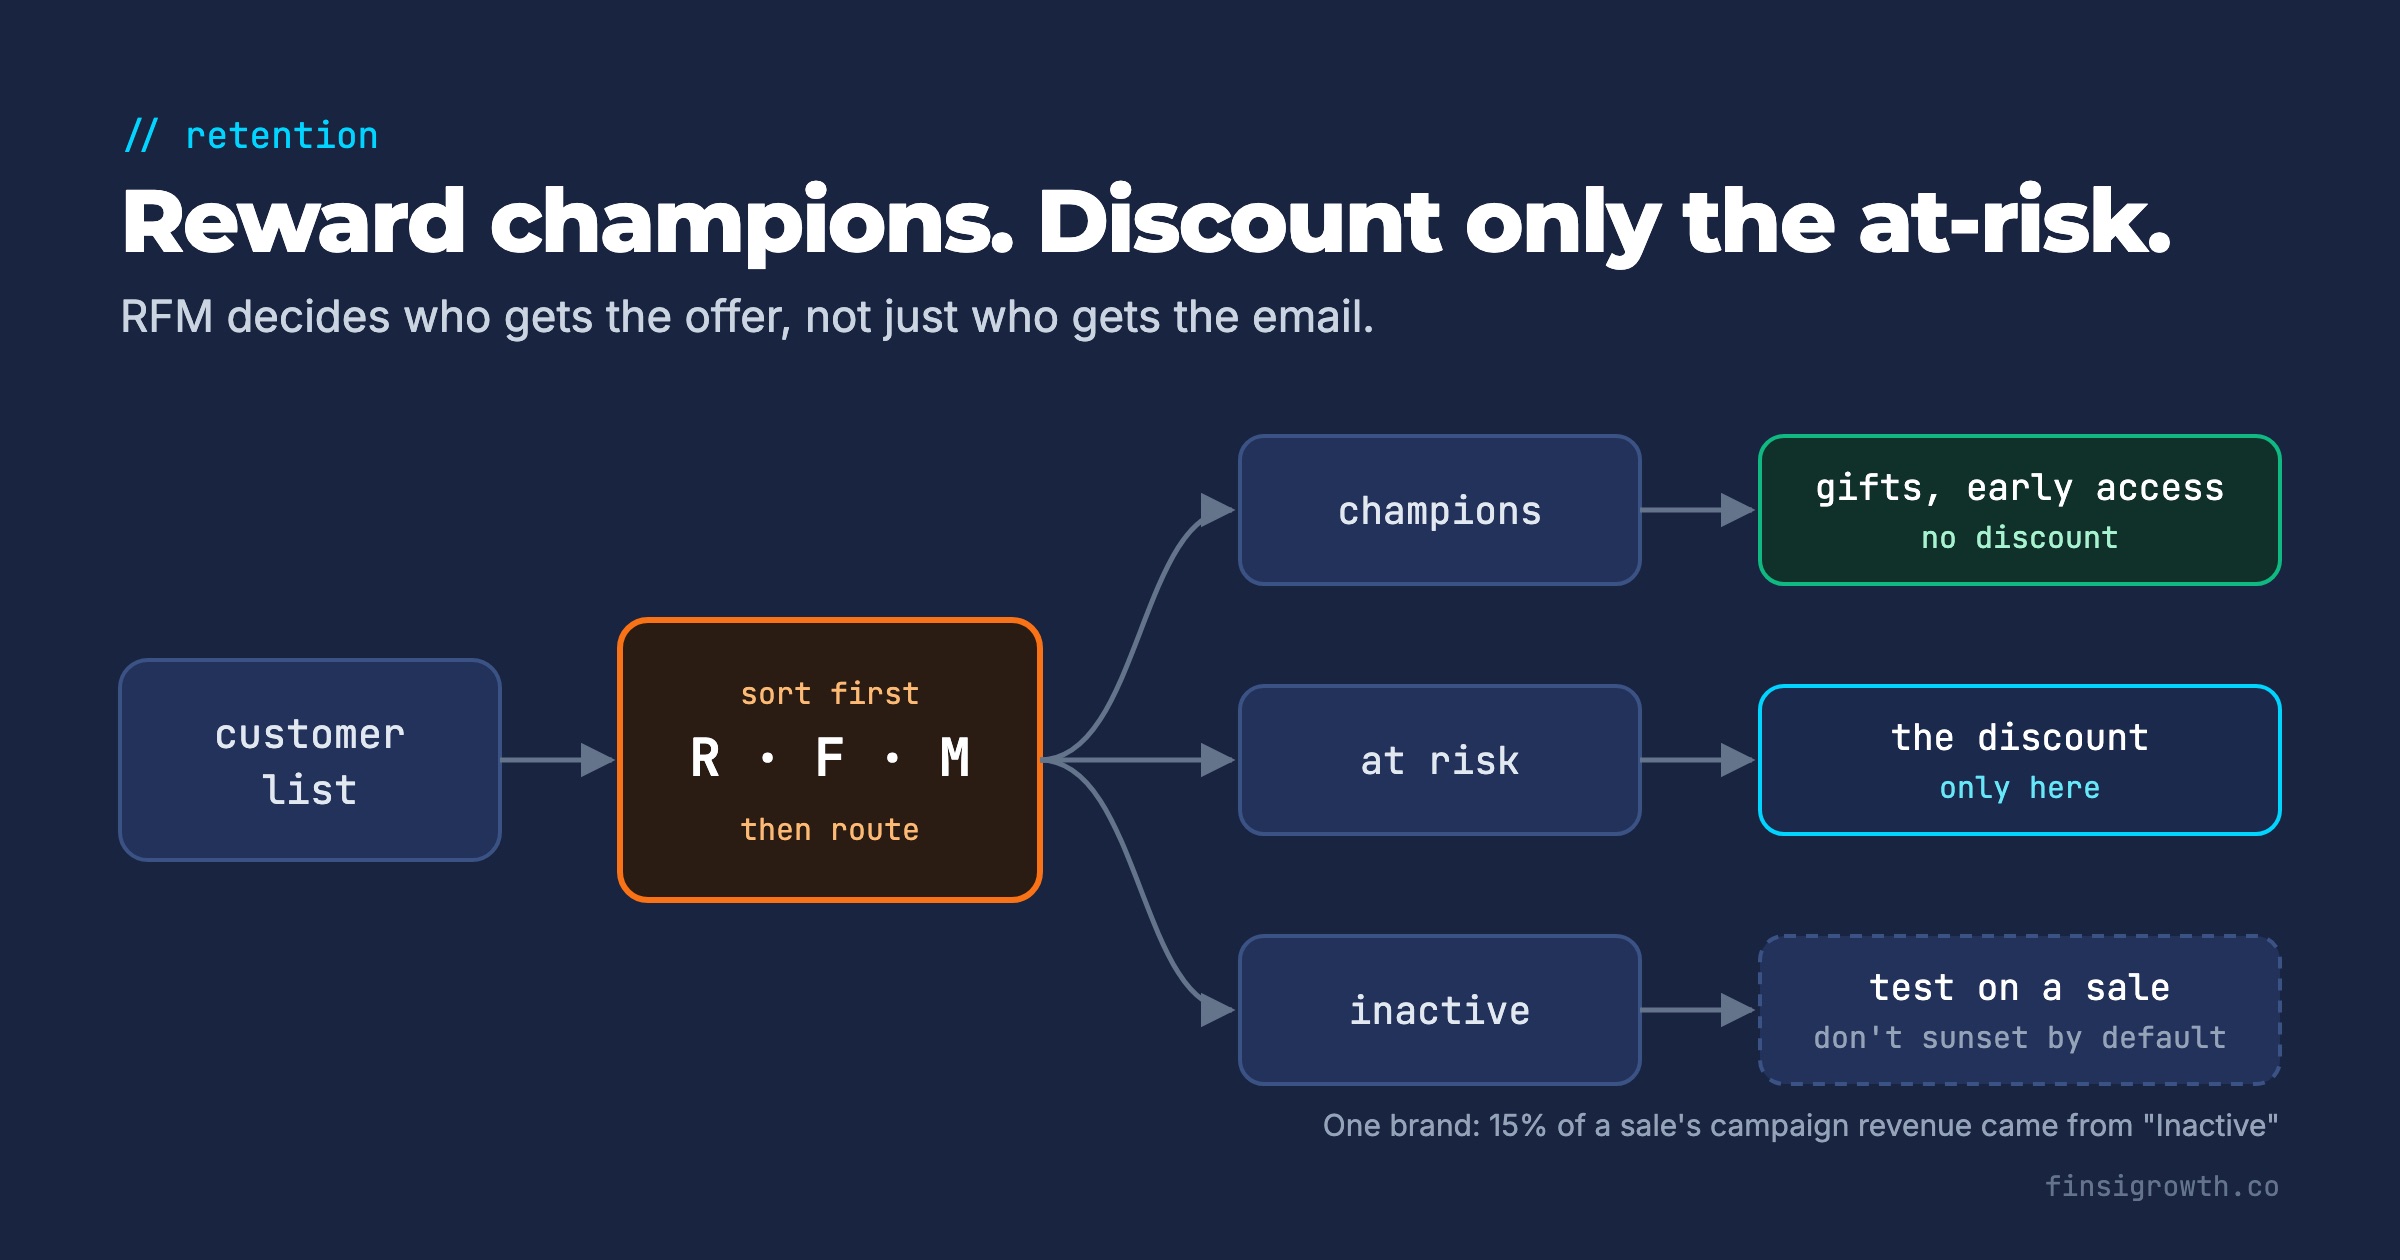
Dollar Shave Club sends automated offers when customers move between RFM groups. Champions get non-monetary rewards. Discounts go to newly at-risk customers. That split is the whole point of segmentation. Your best customers don’t need 15% off to buy again, and paying it anyway erodes contribution margin on your most profitable orders.
New West KnifeWorks went the other way and emailed its inactive segment too. The industry advice is to stick to engaged subscribers. But on one sale campaign sent to all six RFM segments, 15% of campaign revenue came from the “Inactive” group. Some buyers returned after more than three years.
That works for a durable, giftable product with an annual sale moment. It won’t work everywhere. Mailing long-dormant addresses can hurt email deliverability, so send to them on a high-intent occasion, watch bounce and spam rates, and suppress anyone who doesn’t engage.
The decision for you: look at how much discount went to your top RFM segment last quarter. If it’s more than a sliver, move those customers to early access or gifts and keep the discount for at-risk buyers.
When should a win-back flow trigger?
At the point a customer is actually late, based on their own purchase cadence. Cidercade moved from a blanket six-month campaign to flows that trigger after a few weeks without a visit, which matches how often its regulars come in. It also stopped sending them to regulars.
The report doesn’t give Cidercade’s exact rules, but the principle is simple. A win-back campaign should fire when someone passes the gap that most repeat customers fall inside. For a consumable that might be 45 days. For a knife it might be two years.
To find your number, take customers who bought at least twice. Measure the days between first and second order. Trigger win-back at roughly the 75th–80th percentile of that gap. Earlier, and you’re discounting people who were about to buy. Later, and you’re chasing people who’ve already churned.
Harney & Sons adds a useful guardrail: support tickets are written back to the customer profile, so promos pause while an issue is open. Nobody wants a “we miss you, here’s 10% off” email while their order is lost.
Does sending by channel preference help?
It can cut wasted sends. Corkcicle consolidated SMS, automation triggers and reviews from three platforms into one. It now targets campaigns by each subscriber’s predicted channel preference. Its most efficient segment turned out to be customers engaged in the last 90 days who prefer email.
VP of ecommerce Amanda Nelson put the goal plainly: relevant messages “where they like to get them, and not just bang them over the head.”
This matters more for SMS than email, because SMS costs real money per message. If a subscriber reliably buys from email and ignores texts, every text to them is cost with no return.
The decision for you: split your SMS list by whether each subscriber has clicked an SMS in the last 90 days. If a large share haven’t, stop texting them campaigns and let email carry the message. Then check whether total revenue from that group actually drops.
What do the loyalty cases teach?
That redemption rate is a useful early warning, and that the fix can be cheap. Naturium tracks the share of loyalty members redeeming points as a core KPI. When cohort analysis showed redemptions trending down, it launched a lower-barrier offer: 20 points for $1 off.
“We lowered the barrier to entry, which increased our redemption rate,” says CRM and loyalty manager Giovanna Diez. Thirdlove reported a similar result after putting loyalty points inside an on-site hub: redemption hit an all-time high of 30% within 30 days.
One caution. Redemption is a cost, not a goal. A loyalty program earns its keep only if members buy again more often than they otherwise would. Track 90-day retention rate for redeemers versus non-redeemers in the same cohort. If the gap is small, a higher redemption rate just means more margin given away.
Is AI customer support a retention tool?
The two support cases make a decent argument that it’s at least a conversion tool. Ministry of Supply had no 24/7 chat, so shoppers waited for answers. Its AI agent resolved 84% of product recommendation chats and 75% of “where’s my order” chats without a human, over 60 days.
Harney & Sons resolved 77% of recommendation queries the same way. Average ticket resolution time fell 25% in 30 days after it added a helpdesk.
These are the most credible numbers in the report, because they measure the work directly. CEO Aman Advani framed the goal well: “We’re not trying to downsize our customer support team. We’re trying to upgrade their quality.”
What the report doesn’t show is the revenue effect. If you test an AI agent, compare conversion rate for sessions that used chat against similar sessions that didn’t. Then check refund and return rates for chat-assisted orders. A bot that answers sizing questions badly will show up there first.
What we’ve seen working with Harney & Sons
Harney & Sons is a Finsi client, so we’ve seen this from the inside. The AI agent and helpdesk in Klaviyo’s report are the visible layer. What makes them useful is the data feeding them.
One piece of our work there: we joined post-purchase survey responses to each customer’s LTV, order and support history. That showed which kinds of feedback predicted lower repurchase.
That turned into an automation: low scores and complaint responses now open a ticket in Klaviyo Help Desk, so the service team reaches the customer before they quietly churn. It’s the same idea as pausing promos during an open ticket. Support data stops living in a separate tool and starts steering retention.
The lesson for a smaller brand: you don’t need an AI agent to start. You need complaints to reach someone who can act on them, and to land on the customer profile your flows read from. The full story is in our Harney & Sons case study.
What do the share-of-revenue numbers actually mean?
Less than they seem. Four brands report the share of ecommerce revenue “from Klaviyo,” and the range is huge.
Svenfish is a small local seafood shop that emails whatever came in that morning, so most orders follow a message. MESHKI is a global fashion retailer shipping to 190+ countries, where many more orders likely start in other channels. Tatcha’s figure covers only its biggest sale of the year, when email and SMS volume peak. Each number is accurate. None of them is comparable.
They also share a structural problem. Attribution credits any order placed within a window after a message, and depending on your settings, opens can count. Apple Mail Privacy Protection has inflated email opens since 2021. So a customer who was always going to reorder still gets “attributed.” Subscription brands should watch this closely: a recurring shipment that lands inside the window can be credited to email, even though it would have shipped anyway.
“123X ROI” has the same issue. It’s attributed revenue divided by software cost. It says nothing about margin, and nothing about what would have happened without the emails.
How do you measure your own retention program honestly?
With holdouts. It’s the same rule we apply to paid media in when to kill or scale a Meta ad: a channel isn’t judged by its own dashboard.
- Hold out 10% of a flow’s audience at random for 60–90 days. Start with your highest-volume flow, usually abandoned cart, browse abandonment or post-purchase.
- Compare revenue per person between the two groups, not attributed revenue. The difference is the flow’s incremental lift.
- Subtract discount cost. A win-back flow with a 20% code needs to lift revenue by more than the margin it gives away.
- Track cohort repeat rate monthly. If your retention program is working, the share of each month’s new customers who buy again within 90 days should rise. That’s the metric in our guide to the 5 retention metrics every DTC brand should track.
A flow that shows big attributed revenue and tiny incremental lift isn’t useless. It may still be worth running. But you should know which one you have before you build five more like it.
A one-week checklist from the report
You don’t need new software to use most of this. In a week you can:
- Monday: spot-check 20 customers across Shopify, your ESP and SMS tool. Fix mismatches before anything else.
- Tuesday: build or refresh RFM segments. Check how much discount went to champions last quarter.
- Wednesday: calculate your repeat-purchase gap and move win-back triggers to match it. Exclude recent buyers.
- Thursday: split SMS subscribers by 90-day SMS engagement. Stop campaign texts to the non-engaged group as a test.
- Friday: set up a 10% holdout on your biggest flow and note the date to read it.
In 90 days you’ll have your own numbers. They’ll be smaller than the ones in the report, and much more useful, because they’ll be incremental and they’ll be yours.
If you’d like an outside read on which of your flows are creating revenue and which are just collecting credit, that’s what Finsi Growth does for DTC brands. For a broader check of where retention sits in your growth plan, start with the e-commerce scaling scorecard.
Frequently Asked Questions
What is Klaviyo’s Behind the Brands report?
It’s a collection of customer case studies Klaviyo publishes. The 2026 edition (AMER) covers 11 brands, including Dollar Shave Club, Tatcha, Corkcicle, Thirdlove and Harney & Sons. Each case lists the tactic, the Klaviyo tools used and a headline result.
Is Klaviyo-attributed revenue the same as incremental revenue?
No. Attributed revenue counts orders placed within a window after a customer received, opened or clicked a message. Many of those customers would have bought anyway. Incremental revenue is the extra revenue versus a randomly held-out group that didn’t get the message.
What is RFM segmentation in Klaviyo?
RFM groups customers by recency, frequency and monetary value of their purchases. Typical groups include champions, loyal, at risk and inactive. Brands use it to give rewards to their best customers and save discounts for customers who are drifting away.
When should a win-back email be sent?
When a customer passes the usual gap between purchases for your product. Measure the days between first and second orders for repeat buyers. Trigger win-back around the 75th–80th percentile of that gap, and exclude anyone who bought recently.