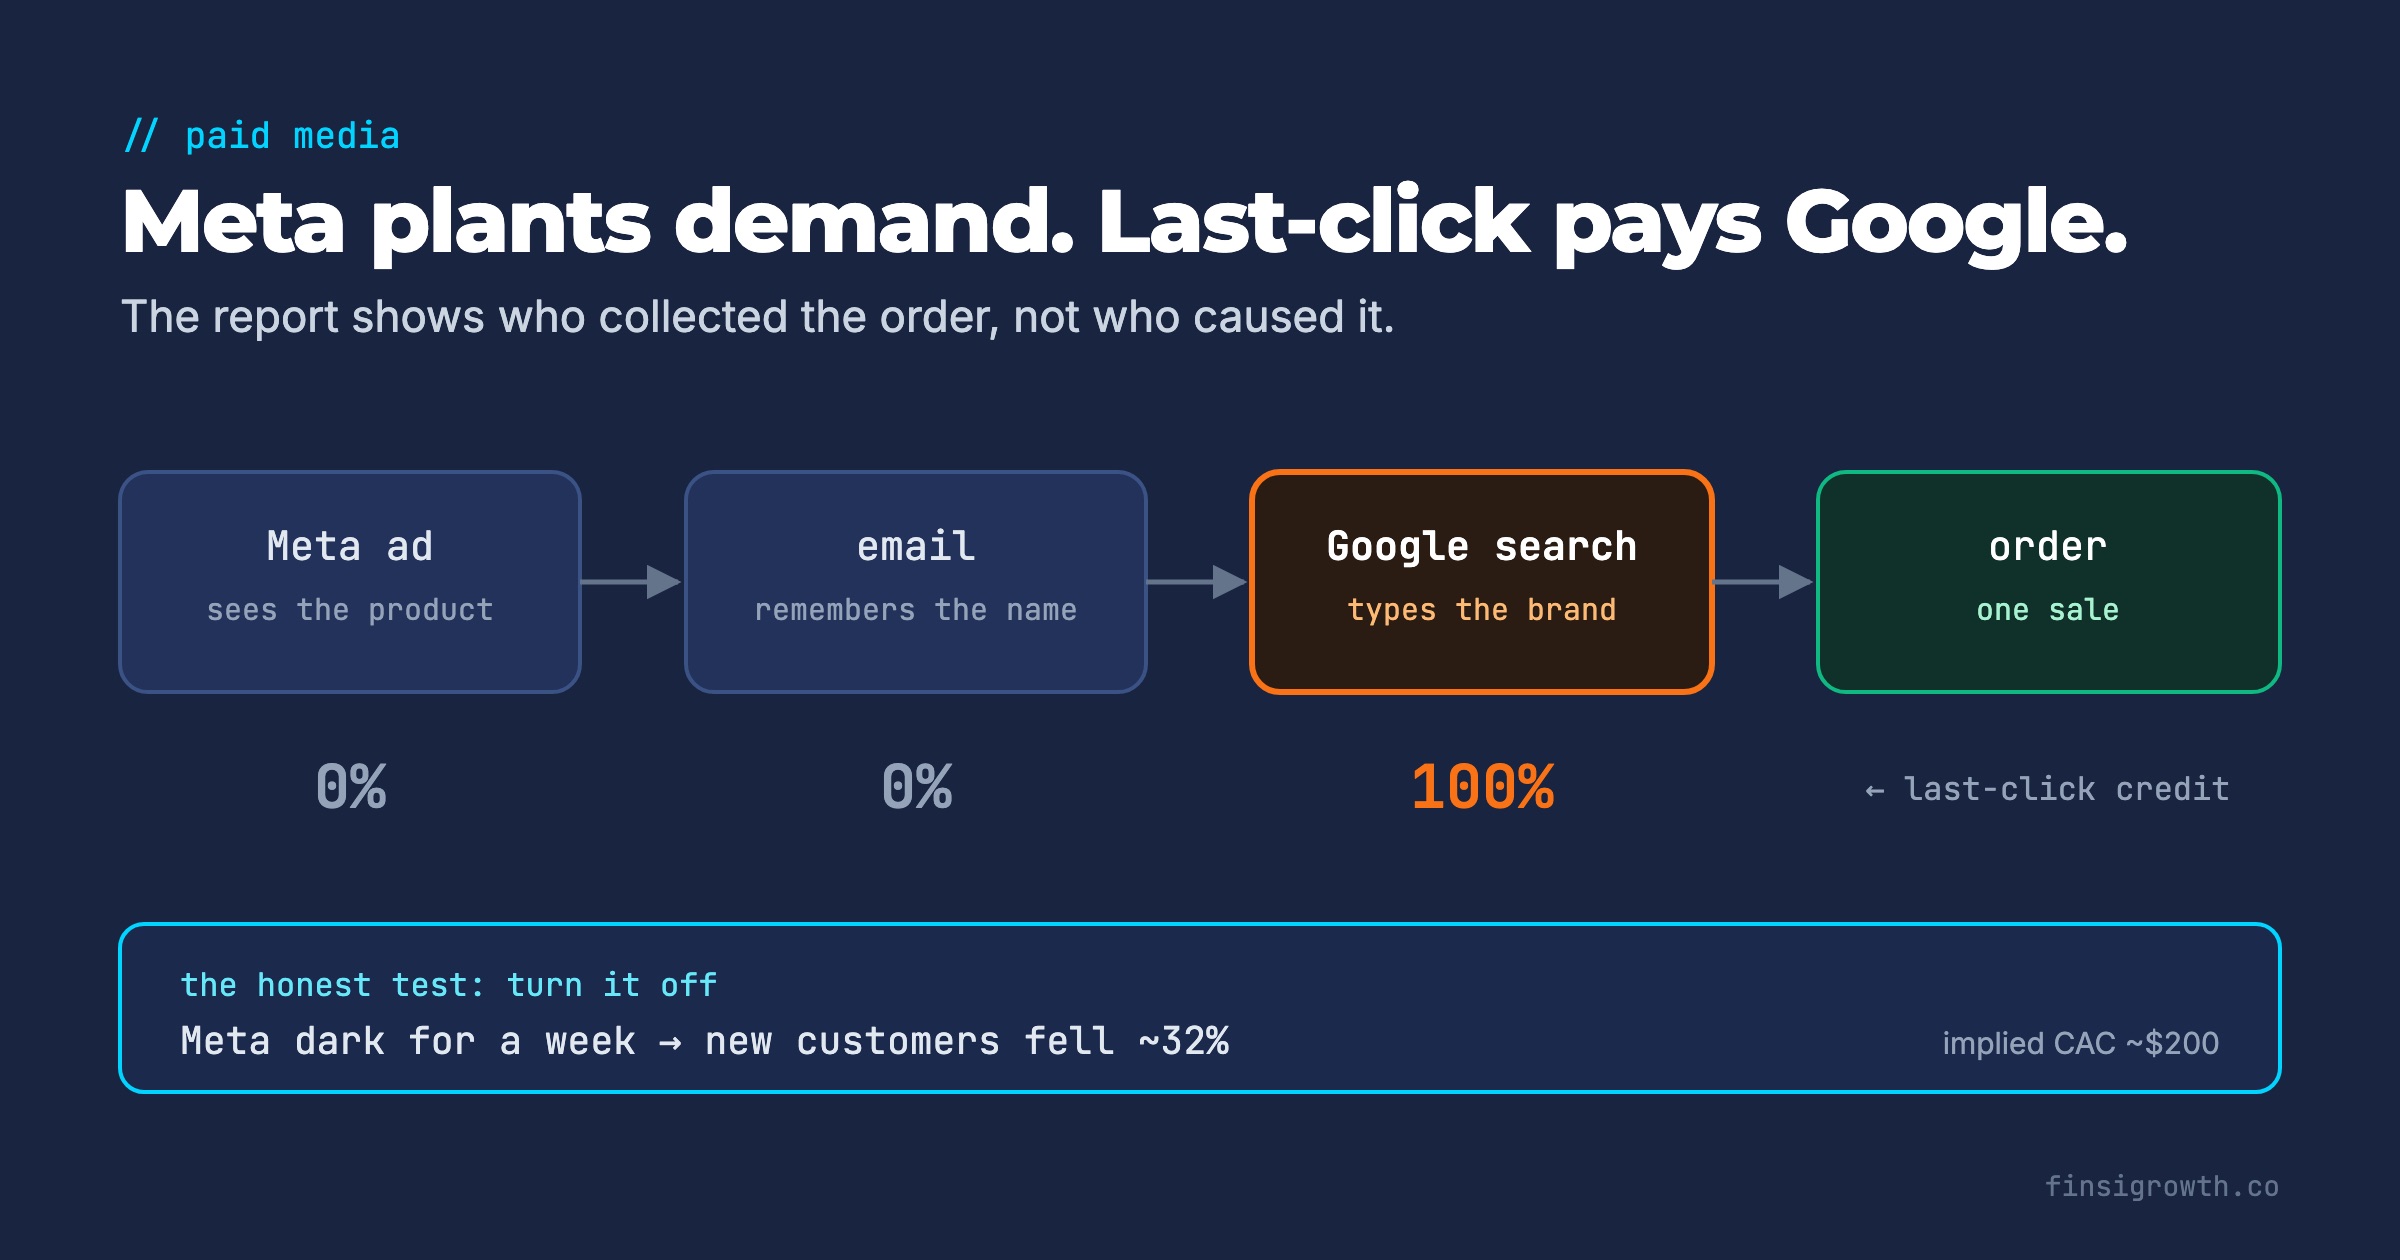
Open almost any last-click report and it says the same thing: Google is your most efficient channel, Meta is your worst, so move money from Meta to Google. The report isn’t broken. It’s answering a narrower question than the one you’re asking. It tells you which channel collected the order, not which one caused it.
Google sits at the very end of most buying journeys. Someone sees a Meta ad or an email, remembers your name, and searches for it a day later. That last search click gets the credit. Shopify’s default reports, GA4 and Google Ads all lean the same way, each for its own reasons. Below: the mechanism, real gaps from brands we work with, and what happened when operators switched channels off. Then an audit checklist for your next budget meeting.
Key Takeaways
- Last-click gives 100% of the credit to the final click. Google search is the final click for a large share of journeys that started on Meta, email, PR or word of mouth.
- Shopify, GA4 and Google Ads disagree, sometimes by 4x. At one tea brand, Shopify’s last non-direct click report credited Google with $249k while Google itself reported $96k.
- Google Ads’ default click-through conversion window is 30 days, and default goals can count clicks and page views as conversions.
- Turning channels off is the honest test. When one brand’s Meta went dark for a week, new customers fell about 32%, an implied CAC of about $200.
- Before you move budget to Google, split brand from non-brand, clean up conversion goals, fix UTMs and run a holdout.
Why does last-click always favor Google?
Last-click favors Google because search is how people come back once they’ve already decided. Meta and TikTok interrupt people who weren’t looking. Email reminds people who already know you. Google waits for the intent to show up as a query, then takes the click.
Brands on our calls describe the same path in nearly the same words:
- A candy brand, June 2026: a Meta ad shows the product, people type the brand name into Google, “Google ad gets credit.”
- Two separate brands in June and July 2026: last-click analysis always says “move money to Google,” because “Facebook creates interest, Google picks it up.”
- A frozen-dumpling brand, June 2026: Google’s reported add-to-cart count was far below the purchases it claimed. That suggests people arrived ready to buy, not to browse.
That’s demand harvesting, and it’s valuable. But a model that credits only the harvest will always recommend cutting the planting. Follow it for a few months and the harvest shrinks too.
If most of your Google credit comes from people searching your name, you have a branded-search problem first. Our branded search audit shows how to split that out. This post covers the reporting layer around it.
Which default reports over-credit Google?
Every tool in your stack has a default that pushes credit toward the last click. None of them are lying on purpose. As we put it to one brand in June 2026, Google is “lying all the time — not intentionally.”
| Report | Default behavior | How it over-credits |
|---|---|---|
| Shopify marketing reports | Last non-direct click | Skips direct visits and credits the last marketing click, often a brand search |
| Google Ads | Data-driven attribution, 30-day click window | Counts conversions Google saw anywhere in a long window, on goals you may not have checked |
| GA4 | Session-based acquisition reports credit each session’s source | Misses sessions it can’t track and still counts bot traffic as real |
| Klaviyo | Opens and clicks within its attribution window | Credits email for orders Google and Meta also claim |
Shopify: last non-direct click
Shopify is the reference we trust most, because it has nothing to gain. But its default model still hands Google a lot. At an established tea brand, Shopify credited Google Ads with $249k for January 1–22, 2026, using last non-direct click. Google’s own interface reported $96k for the same period.
How can Shopify give Google more than Google claims? Last non-direct click ignores direct visits. If a customer clicks a brand ad on Monday and types your URL on Thursday to buy, the order goes to Google. Google’s own model may split that journey differently or drop it. Neither number is the incremental one.
Shopify also only sees what your tracking lets it see. One brand found Shopify’s customer journey data covered just 4–40% of orders, depending on the channel, and about 60% of its ads were missing UTMs (March 2026). Another brand’s Meta ads reported about $11–12K of revenue, while Shopify showed about $2K from Facebook and Instagram. The cause: none of its ads had UTM parameters, so the sales landed as “organic” (August 2026). Missing UTMs on Meta make Meta look worse and everything else look better.
Google Ads: long windows and loose goals
Google Ads’ default click-through conversion window is 30 days. Engaged-view gets 3 days and view-through 1 day (Google Ads Help, conversion windows). Data-driven attribution is the default for most conversion actions, and the older rule-based models are no longer supported (Google Ads Help, attribution models). You can’t switch Google to a simple last-click view inside Google Ads anymore.
Gaps between Google and Shopify are routine. A founder on a discovery call saw Google report $25,000 in revenue where Shopify attributed $6,000 (April 2026). The bigger leak is conversion goals. At an organic juice brand, Google’s default setup was counting clicks and page views as $1 conversions (June 2026). Once we cleaned it up, the true CPA was $13–25. Before the fix, Google showed 101 purchases for a period when Shopify attributed exactly 1 purchase to Google, out of about 400 total orders (July 2026).
A men’s grooming brand had a “sign up” goal that was really a page view (August 2026). That matters twice. It inflates reported results, and Google’s bidding optimizes for the actions it sees. Feed it a page view and it buys you page views.
GA4: partial sight and bots
GA4 often sees a smaller, noisier picture than the platforms. One brand recorded about 50% fewer sessions in GA4 than Facebook claimed to send (April 2026). At the juice brand, about half of GA4 traffic turned out to be bots. Removing a stray _gl URL parameter cut Google Merchant clicks by 42%, most of it junk traffic (September 2026).
Everyone at once
Add the platform reports together and they rarely fit inside your revenue. One brand found Meta and Google together claiming about 120% of revenue (August 2026). Email often claims a slice of the same orders, which is why we move Klaviyo to click-only attribution at the brands we work with. For the full reconciliation method, see platform revenue vs. Shopify.
What happens when brands actually turn channels off?
Shutting a channel off and watching total sales is the cleanest evidence you’ll get without a measurement vendor. Here’s what operators told us after doing it, on purpose or by accident:
| What was turned off | What happened | What it tells you |
|---|---|---|
| Meta, about $2K a week, off for a week by accident (September 2026) | New customers fell about 32%, roughly 12 fewer a week, an implied CAC of about $200 | Meta was creating customers that other channels collected |
| Facebook cut at a men’s grooming brand (July 2026) | Google, direct and organic all dropped | Part of Google’s “own” conversions started on Meta |
| Meta, then Google, both fully off at the dumpling brand (June–July 2026) | Sales fell about 30%; about 40 orders a week kept coming via organic | A real share of demand existed without any paid media |
| Google Ads shut down at one brand (April 2026) | 4-week average weekly revenue went from $220K to $190K, about −15% | Google added real revenue, just less than a report can prove |
Client results are specific outcomes, not typical or guaranteed.
Two things stand out. First, cutting Meta hurt the channels that get credit for Meta’s work, which is exactly what last-click hides. Second, Google wasn’t worthless. At the brand that shut it down, weekly revenue fell about 15%. The lesson isn’t “Google is fake.” It’s that the report can’t tell you how much is real.
Last-click can also under-credit Google. At the juice brand, one product page took 17% of Google spend and 34% of clicks but only 3% of orders over four weeks (August 2026). That product has thousands of Amazon reviews, and many shoppers go check Amazon before buying. The grooming brand saw Google campaigns with almost zero DTC conversions that appear to feed Amazon sales. If you sell on Amazon, last-click on your Shopify store misses that halo entirely.
So the bias usually runs toward Google, but not always. The fix is the same either way: test, don’t trust the default.
The last-click audit checklist
Run this before anyone proposes moving budget between Meta and Google. Each item takes under an hour.
- Split brand from non-brand in Google. Report them as two lines. Brand ROAS should never justify non-brand budget. (Method in the branded search audit.)
- Open every Google conversion action. Confirm each “primary” goal is a real purchase. Demote clicks, page views, sign-ups and add-to-carts to secondary.
- Compare three numbers for the same 30 days. Google-reported purchases, Shopify orders attributed to Google, and total Shopify orders. If Google’s number is more than double Shopify’s, find out why before doing anything else.
- Check for bot and junk traffic. Look for sessions with near-zero engagement, odd geographies or tracking parameters you didn’t add. Fix them before reading any rates.
- Audit UTMs on every Meta and TikTok ad. Untagged paid traffic gets credited as organic or direct. That pushes credit away from the channels that created the demand.
- Sum every platform’s claimed revenue. If the total exceeds actual revenue, write down by how much. That’s your over-attribution margin.
- Move email to click-only attribution with a short window, so it stops claiming orders that paid channels also claim.
- Tag campaigns by job. Prospecting, retargeting, brand and non-brand get separate labels, so you compare like with like.
- Compare the claim with MER. If last-click says Google drove a big lift but total revenue over total ad spend didn’t move, the lift wasn’t real.
- Run a holdout before any large shift. Pause one channel for at least 7 days in a quiet week, or cut it in a set of regions. Watch total and new-customer orders.
Agencies that report only in-platform numbers will fail half of this list. If that’s your situation, our post on agency KPIs that are always green covers what to ask for instead.
What to do this week
- Pull last month’s numbers three ways. Google-reported revenue, Shopify last non-direct click revenue for Google, and total Shopify revenue. Put them side by side in one sheet.
- Fix conversion goals. In Google Ads, open Goals, check every primary conversion action, and demote anything that isn’t a purchase.
- Spot-check 20 Meta ads for UTMs. If any are missing, add them and note the date, so you can see the before and after.
- Write a holdout plan. Pick the channel last-click says to cut and a 7–14 day window. Name the metric you’ll read (new-customer orders in Shopify) and the threshold that would change your mind.
- Change the budget rule. No budget moves between Meta and Google on last-click data alone. Every shift needs a holdout result or a contribution margin read on blended numbers.
The decision this leaves you with
Last-click isn’t wrong. It’s a receipt that shows who handed the customer the bag. It can’t show who brought them into the store. Use it to spot broken tracking and compare campaigns within a channel. Don’t use it to decide how much of your budget belongs to Google. That answer only comes from turning things off and counting total orders.