If every line of your agency’s monthly report is green and your bank balance isn’t, the report is measuring the wrong things. Agencies choose the metrics they report, and they choose metrics they can win on: ROAS, open rates, attributed revenue, share of voice.
Three numbers are much harder to dress up. New customers per week, counted in Shopify. Repeat revenue in absolute dollars, not as a share. And a written test brief for every experiment, with a decision logged at the end. Below are the six failure patterns we see most often on client and discovery calls, and the checklist that catches each one.
Key Takeaways
- A green report usually means the agency picked metrics it controls. Ask for metrics your Shopify data controls instead.
- Count new customers from first orders in Shopify. Ad platforms’ “new customer” labels and blended ROAS can both stay healthy while acquisition decays.
- A rising repeat-revenue share can be bad news. If new-customer revenue collapses, the returning share rises automatically. Track repeat revenue in dollars.
- Efficiency metrics hide lost volume. An agency can protect ROAS by refusing budget and still miss a third of a peak.
- No written brief means no test. Every experiment needs a hypothesis, a spend threshold, a decision date and a logged result.
Why does every agency report look green?
Because the agency writes it. That’s not a conspiracy, it’s selection. Out of fifty possible metrics, the ones that make the monthly deck are the ones that moved the right way.
An operator at a home-water brand described it on a call this month. Agencies “report back to the client everything is green,” the operator said, while “70% of your campaigns aren’t optimized towards anything.” A founder at a supplement retailer named the structural problem. When the agency is the one making the changes, “they’re not gonna point out any anomalies.”
We covered why this happens in the incentive math behind agency fee models: an agency paid on spend will optimize spend. This post is the other half. Whatever the contract, here’s how green reports go wrong and what to track instead.
The 6 patterns behind “everything green”
1. ROAS is green because the agency refused to spend
Efficiency metrics improve when you spend less. So an agency graded on ROAS has a quiet reason to turn down budget at exactly the moment a brand should be leaning in.
One operator told us about a Father’s Day when the brand asked the agency to raise bids. The agency declined. The brand missed about a third of its expected Father’s Day sales, and the agency’s explanation was “oh we have great ROAS.” The report was green. The peak was gone. Client results are specific outcomes, not typical or guaranteed.
The KPI that catches it: revenue and new customers against a written plan for each peak, alongside efficiency. ROAS without volume is half a sentence.
2. Blended numbers are green while new customers disappear
This is the slowest and most expensive pattern, because nothing on the dashboard turns red. Returning customers keep buying, blended ROAS holds up, and acquisition erodes underneath.
A consumer brand we spoke with in March watched new-customer revenue fall from 50% of the total to about 25% over 12–18 months. The founder’s verdict: “I wish I would have been more on top of it twelve months ago.”
Platform labels won’t save you here. A tea brand we work with ran Meta campaigns with existing-customer exclusions and still found only 27–30% of attributed buyers were actually new. Google’s new-customer-only mode came in around 29%.
The KPI that catches it: new customers per week, defined as first orders in Shopify, and new-customer CPA (total paid spend ÷ new customers). Don’t use the platform’s own definition. Pair it with CAC by channel and you’ll see erosion in weeks, not years.
3. Repeat share is green because acquisition collapsed
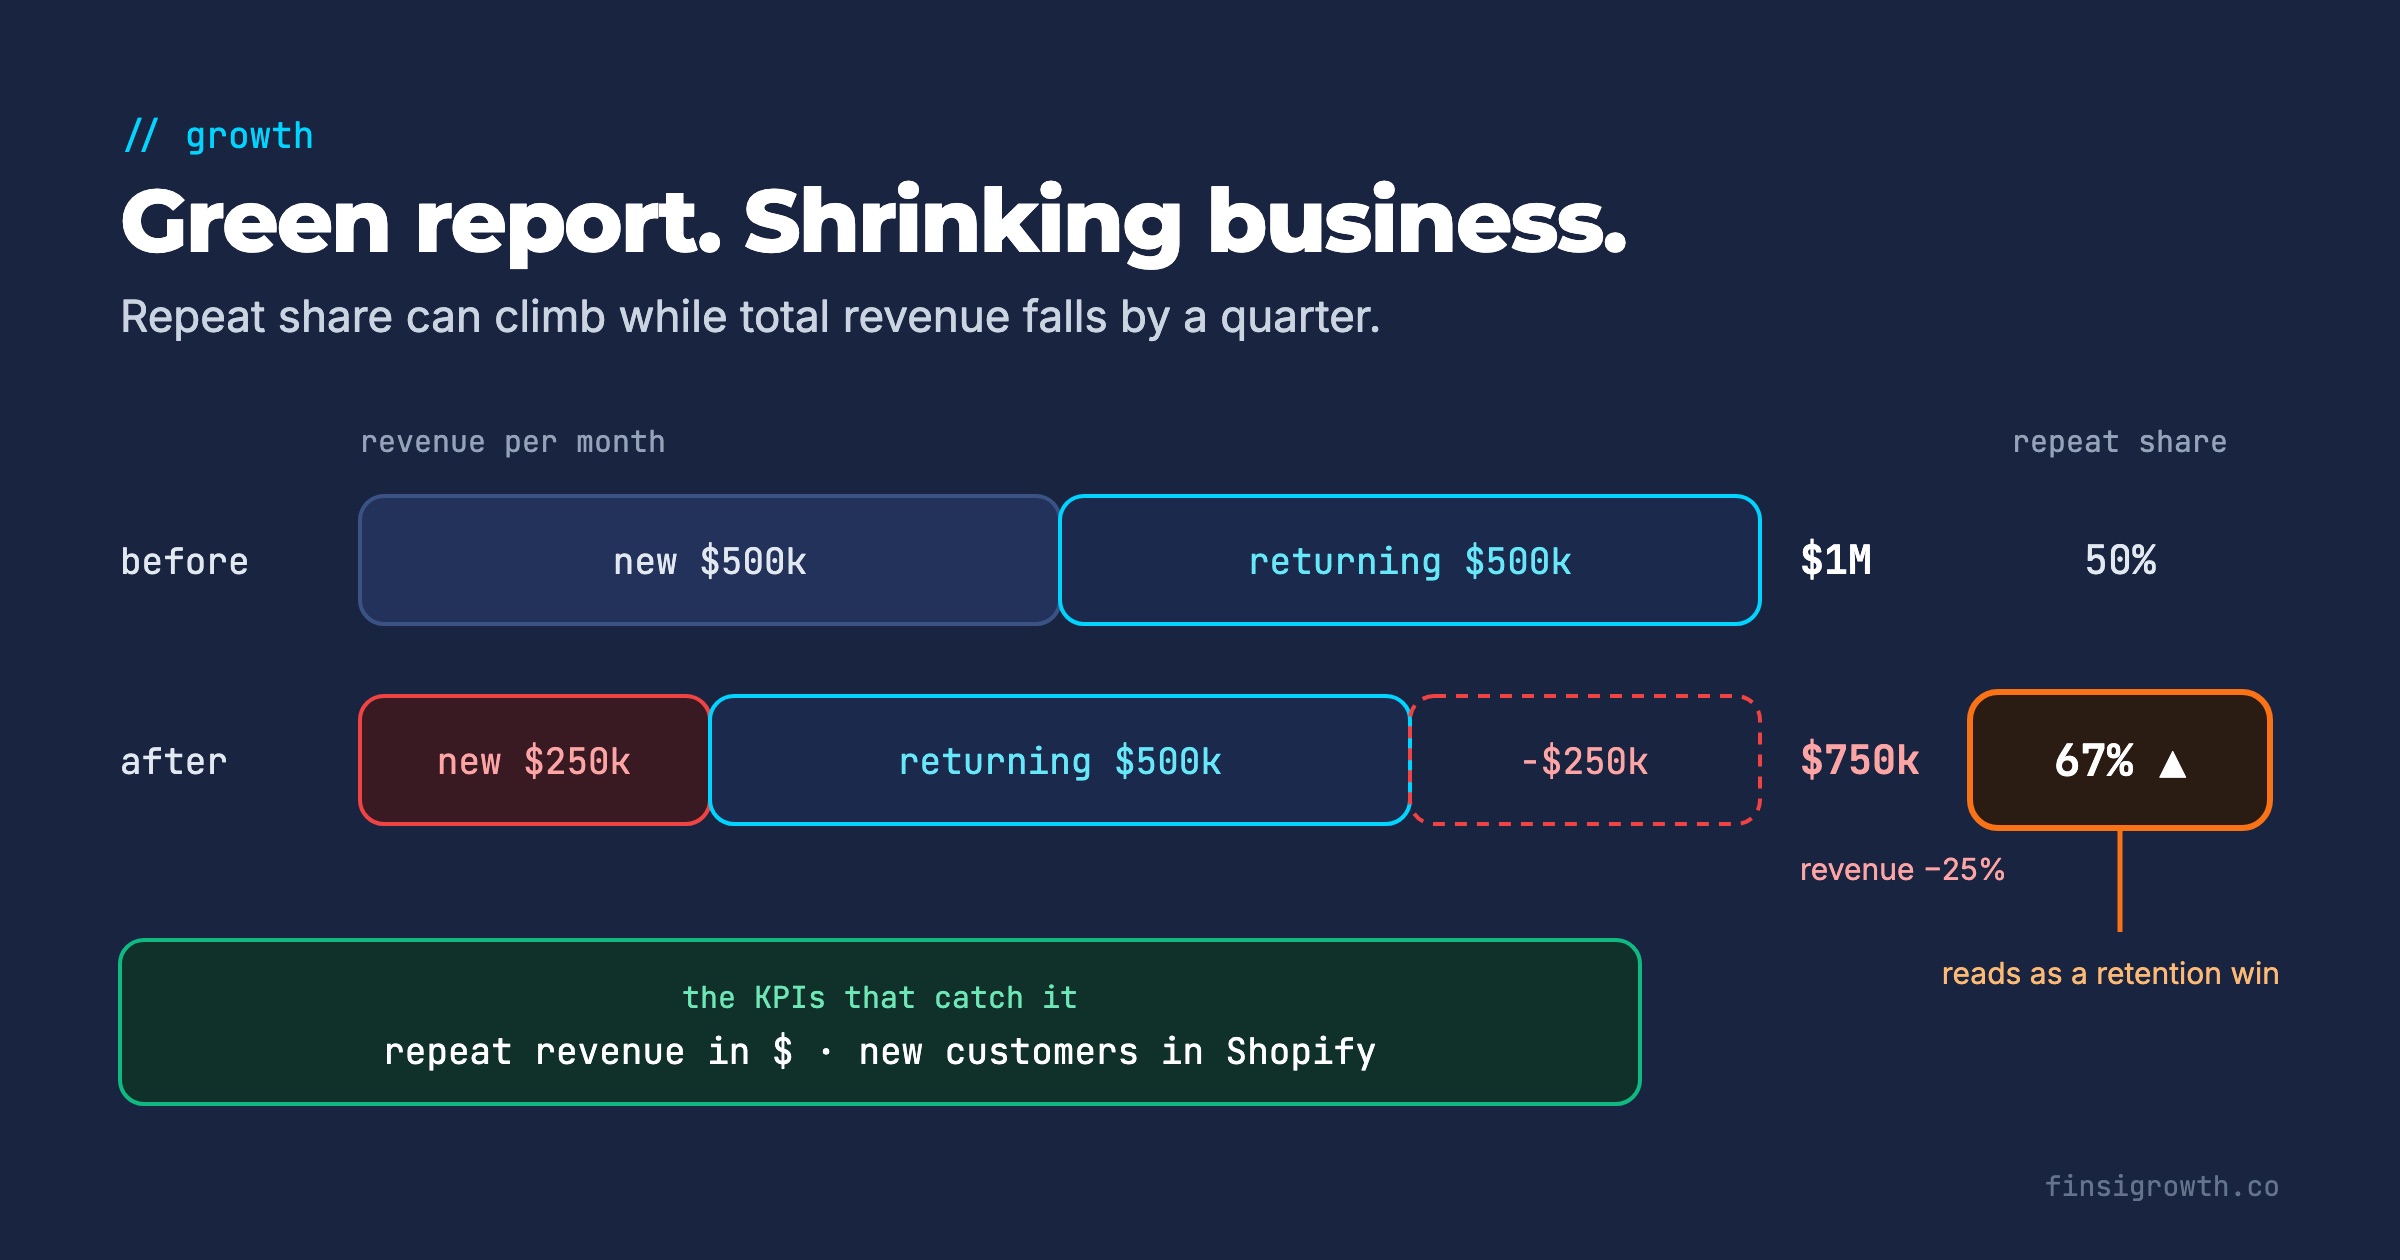
Here’s the trap in the chart above. On a retention dashboard, a returning share going from 50% to 75% looks like a retention win. It isn’t necessarily. Shares must add to 100%, so if new-customer revenue shrinks, returning share rises even if returning customers bought nothing extra.
A quick illustration. Say revenue is $1M a month, split 50/50. If new-customer revenue halves to $250k and returning revenue holds at $500k, total revenue falls to $750k. Returning share jumps to 67% while the business shrank 25%.
The opposite error happens too. A founder at a growing DTC brand spent six months cleaning data and found the P&L an agency had built was wrong. The returning-customer share was 33%, not the 55% everyone believed. “All my strategies… I was moving them towards return customers.”
The KPI that catches it: repeat revenue in absolute dollars per month, by first-order cohort. Read it next to the new-customer count. Our guide to cohort-based retention metrics shows how to set up the cohort view.
4. Email revenue is green because of the attribution window
Email reports are the easiest to inflate, because the attribution rules are generous by default and opens are no longer a reliable signal. Apple’s Mail Privacy Protection “stops senders from using invisible pixels to collect information about the user” (Apple, June 2021). An open rate that looks great may say little about who read anything.
What we’ve seen on calls in the last few months:
- On one beverage brand’s account, the same 30 days showed email at about 20% of revenue on default settings and 11% on a 3-day click window.
- At one brand, an email agency’s “revenue” came almost entirely from the pop-up. Campaigns produced 1–2 orders over 6 months.
- Another agency emailed 30,000 people and produced 5 sales.
Client results are specific outcomes, not typical or guaranteed. The KPI that catches it: email revenue on a short click-only window, reconciled to Shopify orders. We covered the window settings in click-only Klaviyo attribution.
5. Activity is green, but there’s no test brief
“We launched 12 new creatives” is activity. A test is a written claim that can be proven wrong. Without the brief, nobody can tell a learning from a guess.
One edibles brand writes its creative briefs and hooks quickly now, but the founder named the missing piece: “what did we learn … how do we feed that back in.” A board-game brand described a previous agency’s approach as “none of it was scientific.” And a vinyl subscription club spent 5 months with an agency that was “just staying completely steady.”
The same edibles brand shows what a written rule looks like. It makes no kill-or-keep call until an ad has spent more than $500, and its scale signal is a new-customer CPA of about $40–50. That’s a decision rule anyone can audit.
The KPI that catches it: every test gets a one-page brief before launch, and a logged decision after. If the agency can’t show the brief, the test didn’t happen.
6. Nothing turns red because nobody is watching
Some failures never appear in a monthly report because they happen between reports.
- One brand saw weekend overspend from Friday to Sunday that went unanswered until Monday. “If you don’t have eyes in the account every single day…”
- An agency turned on Google ads for a single SKU with free shipping and “almost lost $40,000 on a single item.”
- A wellness brand’s previous agency, used to big consumer-goods accounts, optimized for “share of voice,” an awareness metric that told a DTC brand nothing about orders.
- Several founders told us agencies “won’t initiate anything unless we bring up a problem” and want extra fees for audits: “it’s always coming from us.”
Client results are specific outcomes, not typical or guaranteed. The KPI that catches it: daily alerts on spend pacing and CPA by ad set, owned by someone who isn’t the agency. One outdoor retailer built an internal tool “so we can at least challenge them more.” You don’t need to build software to do that, just a daily check someone actually reads.
The checklist that keeps agencies honest
Use this in every monthly review. Each line pairs a metric the agency tends to report with the one you should ask for.
| What the report shows | What to ask for instead | Where to get it | Red flag |
|---|---|---|---|
| ROAS / platform ROAS | Revenue vs. plan and MER from Shopify | Shopify + ad spend | ROAS up, revenue below plan |
| ”New customers” from Meta/Google | First orders per week in Shopify; new-customer CPA | Shopify customer order count | Flat or falling for 4+ weeks |
| Returning share of revenue | Repeat revenue in dollars by cohort | Shopify orders by customer | Share rising while new-customer revenue falls |
| Email attributed revenue, open rate | Click-only, short-window email revenue | Klaviyo with custom window, reconciled to Shopify | Big gap between default and click-only (e.g. 20% vs 11%) |
| Creatives launched, tests “running” | Written test briefs with decisions logged | Shared doc or sheet | Tests without a decision date |
| Monthly summary | Daily spend pacing and CPA alerts | Ad platform rules or your own check | Weekend surprises found on Monday |
Two more lines belong in the review, even though no agency report includes them. The first is contribution margin after ad spend, by month. The second is LTV to CAC by acquisition source. One operator told us that giving each traffic source its own LTV row in reporting made the acquisition-versus-retention arguments disappear. Nobody could claim credit the cohort didn’t show.
What should a written test brief include?
Keep it to one page. If it takes longer to write than the test takes to run, it’s too long.
- Hypothesis: “A UGC hook about sleep will lower new-customer CPA versus our current best ad.”
- Primary metric: one number, defined (new-customer CPA from Shopify first orders, not platform CPA).
- Spend threshold: how much spend before anyone makes a call. A useful default is 3x your target CPA. For Meta, check it against our learning-phase budget math.
- Decision date: the day the call gets made, whatever the result.
- Decision rules: what result means scale, what means kill, what means “inconclusive, retest.”
- Result and decision: filled in on the date, with the number.
- What we learned: one sentence that changes the next brief.
Line 7 is the one that’s usually missing, and it’s the one that makes the next test smarter.
What to do this week
- Pull 12 months of first orders from Shopify and plot new customers per week. If the trend is down while the agency report is green, that’s your first agenda item.
- Rebuild repeat revenue in dollars. Take monthly revenue from returning customers, not the percentage. Check whether a rising share is really a falling denominator.
- Recalculate email revenue on a 3-day click-only window for the last 30 days. Compare it with what the agency reported.
- Ask for the briefs. Request the written brief and the decision for the last five tests. Count how many exist.
- Rewrite the monthly report template around the checklist table above. Send it to the agency before the next review, so it isn’t a surprise.
- Set one daily alert on spend pacing, owned by someone on your team.
If your reports still produce no decisions after this, read our piece on operator reports people act on.
Green should mean something
A report that’s always green isn’t reassuring. It’s uninformative. Real businesses have red weeks, and a partner who shows them to you early is worth more than one who explains them later.
Ask for numbers the agency can’t choose: new customers from Shopify, repeat revenue in dollars, and a brief for every test. Then let the colors fall where they fall.