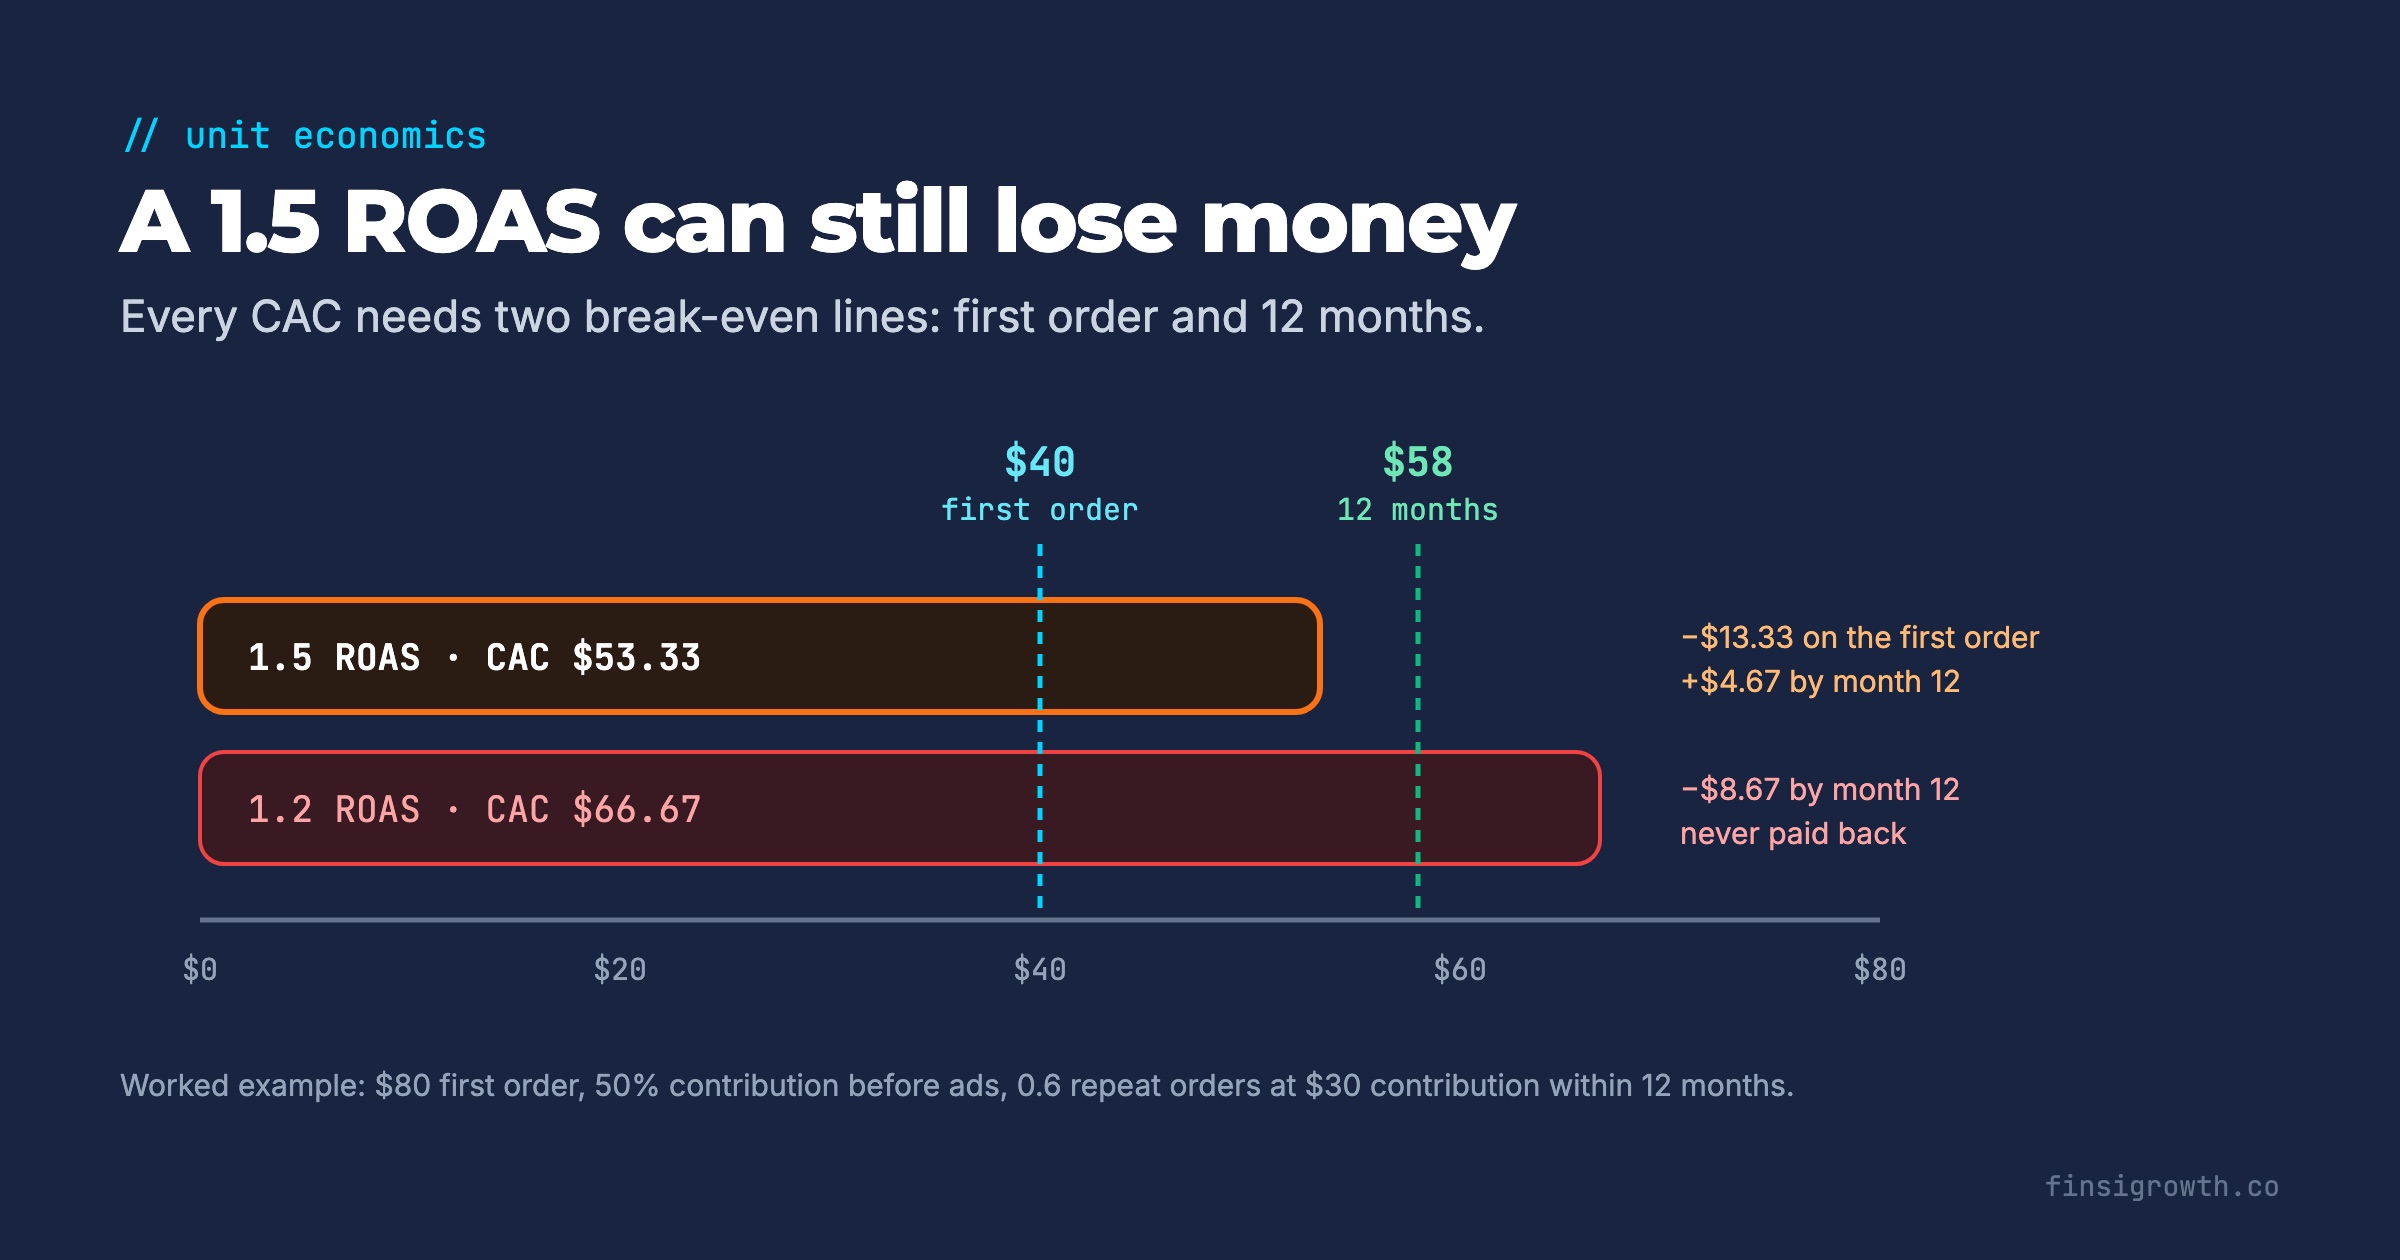
Your break-even CAC is the most you can pay for a new customer before that customer costs you money. There are two versions, and you need both. The first-order number is the contribution from the first order alone. The LTV number adds the contribution from repeat orders inside a fixed window, usually 12 months.
Most small brands run on neither. They run on ROAS, and they treat anything above 1.0 as “paying for itself.” That’s how a 1.5 ROAS account loses money on every new customer while the dashboard looks fine. Below, we build both numbers from scratch with a worked example, then show how to turn them into a kill line and a scale line.
Key Takeaways
- First-order break-even CAC = first-order revenue minus COGS, shipping, payment fees and returns. Break-even ROAS is 1 divided by that contribution margin.
- At a 50% contribution margin before ads, you need a 2.0 ROAS just to break even on the first order. A 1.5 ROAS only breaks even if your margin is 67% or higher.
- LTV-based break-even CAC adds 12-month repeat contribution, on profit, not revenue. It tells you how far you can go below first-order break-even, and how long you’ll wait for the money.
- Use new-customer CAC from Shopify, not platform ROAS. A 1.5 in Meta can be a 1.2 in your store, and that gap can flip a 12-month profit into a loss.
- Both break-even numbers cover zero overhead. Set your target CAC below them, and check marginal CAC before every budget increase.
Why isn’t ROAS above 1.0 “paying for itself”?
ROAS compares revenue with ad spend. It ignores everything else the order costs you. A $100 order at a 1.5 ROAS means you spent $66.67 on ads. If the product, shipping and fees cost another $50, you’ve lost $16.67 before rent, salaries or software.
We hear the “paying for itself” framing on almost every discovery call. One subscription brand doing about $1M a year had told its agency exactly that. Its account was spending about $50 for every $64 in revenue, a ROAS near 1.3. A founder who came to us through a podcast put it more bluntly. Their ROAS was “1.something.” When we said that meant losing money, the answer was: “Yeah, but we don’t know how much.”
That last line is the real problem. Not knowing the number means you can’t tell a good month from a slow leak. Two numbers fix it.
1. First-order break-even CAC
First-order break-even CAC is the contribution margin of a new customer’s first order, before any ad spend. If you pay exactly this much to acquire someone, their first order leaves you at zero.
First-order break-even CAC = first-order net revenue − COGS − pick, pack and shipping − payment fees − returns and refunds allowance
Use net revenue, after the welcome discount. A 20%-off first order is a smaller first order, and the margin math has to see that. Include free shipping you pay for, and any gift with purchase. This is contribution margin at the order level, in dollars.
Worked example. Take an illustrative brand with an $80 average first order, after discounts:
| Line | Per first order |
|---|---|
| Net revenue | $80.00 |
| COGS (30%) | −$24.00 |
| Pick, pack and shipping | −$12.00 |
| Payment processing (about 3%) | −$2.40 |
| Returns and refunds allowance (2%) | −$1.60 |
| Contribution before ads | $40.00 (50%) |
So this brand’s first-order break-even CAC is $40. Pay $40 for a new customer and the first order nets zero. Pay $30 and you’re $10 ahead on day one.
The ROAS version falls straight out of it:
Break-even ROAS = 1 ÷ contribution margin before ads
At 50%, that’s 1 ÷ 0.50 = 2.0. Anything under a 2.0 new-customer ROAS loses money on the first order. Here’s how that threshold moves with margin:
| Contribution margin before ads | First-order break-even ROAS |
|---|---|
| 30% | 3.33 |
| 40% | 2.50 |
| 50% | 2.00 |
| 60% | 1.67 |
| 67% | 1.50 |
| 70% | 1.43 |
This is why a 1.5 ROAS is so often a loss. Very few physical-product brands clear 67% contribution after shipping, fees and discounts. If yours doesn’t, every new customer at a 1.5 starts in the red.
The decision it drives: if you need to make money on every order, this is your ceiling. Some brands run that way on purpose. One brand we spoke with this month makes first-order profitability its agency’s main KPI: “we need to make money on every order.” That’s a sound rule when repeat purchase is low or unproven.
2. LTV-based break-even CAC
LTV-based break-even CAC adds the contribution from repeat orders inside a fixed window. It answers a different question: how much can you lose on the first order and still come out even within 12 months?
LTV-based break-even CAC = first-order contribution + expected repeat contribution per new customer within W months
Three rules keep it honest.
- Count profit, not revenue. An operator we spoke with last October put it plainly: calculate LTV on profit, “otherwise, you’re just fooling yourself.”
- Use a fixed window. Twelve months is the usual starting point. A lifetime number assumes cash you may never see, from customers you can’t yet measure.
- Average across all new customers, not just repeaters. If 30% come back, the other 70% contribute zero repeat profit, and the average has to include them.
Worked example, continued. Say 30% of new customers order again within 12 months, and those repeaters average two more orders. That’s 0.6 repeat orders per new customer. Repeat orders run smaller, at $70, with no welcome discount:
| Line | Per repeat order |
|---|---|
| Net revenue | $70.00 |
| COGS (30%) | −$21.00 |
| Pick, pack and shipping | −$12.00 |
| Payment processing (about 3%) | −$2.10 |
| Returns allowance (2%) | −$1.40 |
| Retention costs (codes, SMS, loyalty) | −$3.50 |
| Contribution per repeat order | $30.00 |
Expected repeat contribution is 0.6 × $30 = $18 per new customer. Add the $40 from the first order, and the 12-month break-even CAC is $58.
Take the 0.6 from your own cohorts, not from a benchmark. Shopify’s cohort report shows how many customers from a given month came back, as we walked through in the five retention metrics post. Use cohorts that are at least 12 months old, so the window is complete.
The decision it drives: the gap between $40 and $58 is your room to invest. Spend in that gap and you lose money on the first order, then earn it back later. It also means you’re financing your customers. How long you wait is the payback period.
Does a 1.5 ROAS make or lose money? Run it through both numbers
Now put the same 1.5 ROAS through both break-even lines. At an $80 first order, a 1.5 new-customer ROAS means a CAC of $80 ÷ 1.5 = $53.33.
- First order: $40 contribution − $53.33 CAC = −$13.33 per new customer.
- 12 months: $58 − $53.33 = +$4.67 per new customer, if 0.6 repeat orders actually arrive.
- Payback: you need $13.33 of repeat contribution, or 0.44 repeat orders. If repeats arrive evenly across the year, that’s roughly nine months.
So the honest answer is “barely, and slowly.” You’re profitable on paper over 12 months, but you’re fronting about $13 a customer for most of a year. Scale that to 500 new customers a month and you’re carrying more than $6,600 of new-customer losses every month, before repeat orders catch up.
Then check the ROAS itself. Platform ROAS is what Meta credits itself with, and it’s often higher than what your store shows. Suppose Shopify’s first-time-customer revenue puts the same account at a 1.2:
- CAC becomes $80 ÷ 1.2 = $66.67.
- First order: −$26.67.
- 12 months: $58 − $66.67 = −$8.67. You never get it back.
This isn’t hypothetical. A supplement brand we audited in 2025 had a $112 average order, about $50 in landed product and shipping, and a CAC of $64 to $68. New-customer ROAS had slid from 1.5 to 1.2. Its 12-month revenue per customer was $165 to $175, which sounded healthy. Once we costed every order, the napkin 12-month contribution came out at roughly zero. The founder’s own read was blunt: “My gut has been saying I don’t think we’re profitable on LTV.”
Client results are specific outcomes, not typical or guaranteed.
The decision it drives: compute CAC from Shopify, not the ad platform. Divide ad spend by first-time customers in the same period. If you’re not sure your platform and store numbers agree, reconcile them first.
Why break-even is not your target
Both break-even numbers cover zero overhead. Salaries, software, rent and your own time all sit below contribution margin. A brand that acquires every customer at exactly break-even goes broke at the speed of its fixed costs.
The ~$1M subscription brand above learned this the hard way. On its own numbers, 12-month profit per customer was about twice its CAC. That looks comfortable. But when accrual financials finally arrived, after about two years of cash-basis guessing, the verdict was “we are not profitable… each month we are not making money.” Contribution was positive. It just wasn’t big enough to carry the overhead.
So set targets with room in them. The rules of thumb we see work:
| Number | What it means | How operators use it |
|---|---|---|
| First-order break-even CAC | Most you can pay with zero payback wait | Hard ceiling when repeat rate is low or unproven |
| 12-month break-even CAC | Most you can pay and recover in a year | Hard ceiling for any channel, any month |
| Target CAC | Leaves room for overhead and error | One haircare brand we spoke with targets 12-month contribution at 2× CAC; it was running at about 1× |
| Marginal CAC | What the next customer costs | Checked before every budget increase |
Payback is the second guardrail. Other operators we spoke with over the past six months described needing three to four orders to recover CAC, or a third order before acquisition pays back. That’s fine if you can fund it. It’s dangerous if a 9-month payback lands on a 3-month cash runway. Why the third order matters covers that curve in more detail.
The decision it drives: write down a target CAC that sits below 12-month break-even by at least your overhead per new customer. If you can’t estimate overhead per customer, start with a 2× contribution-to-CAC target and tighten it once the accrual numbers come in.
3. Marginal CAC: the number that moves when you scale
Your average CAC describes the customers you already bought. Marginal CAC is what the next customer costs at a higher budget. It’s almost always higher, because each extra dollar reaches a less interested audience.
Marginal CAC = (new spend − old spend) ÷ (new customers − old customers)
Say you go from $10,000 to $15,000 a week. New customers rise from 200 to 260. Average CAC moved from $50 to $57.69, which looks tolerable. But the extra $5,000 bought 60 customers, a marginal CAC of $83.33. Against a $58 break-even, that increment loses about $25 per customer.
One operator we spoke with this month runs a brand with LTV around $700 to $800 and CAC around $120 to $130. They estimated that a 5× budget would push CAC toward $300. That’s still under their LTV, but the gap shrinks fast. On a small brand with a $58 break-even, the same curve gets ugly much sooner.
Costs have also moved under everyone this spring. Across brands we work with, CPMs and CPAs stepped up in early March. One operator told us they acquired customers at $30 two years ago and pay about $75 now. If your break-even numbers are a year old, they’re probably describing a cheaper auction than the one you’re in. That’s also why budget changes need their own math on Meta.
The decision it drives: when you raise spend, judge the increment, not the new average. If marginal CAC crosses your 12-month break-even, the last budget step lost money, even if blended ROAS still looks fine.
Common mistakes that inflate break-even CAC
- Using blended numbers. Blended ROAS includes returning customers who’d have bought anyway. Break-even CAC only applies to first-time customers.
- Leaving discounts in revenue. Measure the welcome-offer order at what the customer actually paid. Deep first-order discounts also tend to pull in customers who repeat less, which shrinks the LTV number too. Discount depth and cohort quality covers that link.
- Averaging COGS across the catalog. If your entry product carries 15% COGS and your hero carries 45%, one blended margin hides which campaigns lose money. One founder we spoke with this month put it simply: you “can’t spend $25 to acquire a customer who buys a product that we make $10 on.”
- Counting LTV on revenue. A $170 12-month revenue figure and a $0 12-month contribution can describe the same customer.
What to do this week
You can build both numbers in a spreadsheet in an afternoon. Here’s the order we use:
- Pull 90 days of first-time-customer orders from Shopify. Export net revenue after discounts, COGS, shipping cost, payment fees and refunds. Average them per order.
- Compute first-order break-even CAC and break-even ROAS. Contribution in dollars is the CAC line. One divided by contribution margin is the ROAS line.
- Pull a cohort that’s at least 12 months old. Count repeat orders per new customer, including the ones who never came back. Multiply by your average repeat-order contribution.
- Add the two for your 12-month break-even CAC. Then set a target below it. A 2× contribution-to-CAC target is a reasonable start.
- Recompute last month’s new-customer CAC from Shopify. Divide total paid spend by first-time customers. Compare it with both break-even lines.
- Check the marginal CAC of your last budget increase. Compare spend and new customers in the week before and after. If the increment sits above 12-month break-even, step back down.
- Put the two lines on your weekly scorecard. The E-commerce Scaling Scorecard has a slot for CM3 and payback. Add the break-even CACs next to them.
The two lines you can’t skip
ROAS is a receipt. Break-even CAC is the price tag. Know the most you can pay on the first order, the most you can pay over 12 months, and what the next customer costs. Then make the budget call on those three numbers, not on whether the ads are “paying for themselves.”