A first order doesn’t make someone a customer. It’s a trial. Across the brands we work with and talk to, the biggest losses happen at the second order. The next-biggest happen at the third. After that, the curve flattens and people start behaving like regulars.
That’s why we treat the third order as the real conversion event, and why we’ve stopped leading retention reviews with an average churn rate. The metric that tells you where customers leave is next-order probability: of the people who’ve placed n orders, what share place order n+1? Below are the benchmark ranges we’ve collected, where the drops sit, and how to build the number from a Shopify export.
Key Takeaways
- Next-order probability is the share of customers with n orders who go on to place order n+1. It shows where customers leave. An average churn rate only shows how many.
- In our client and discovery calls, the 1st-to-2nd step ranged from about 16% to about 70%. The 2nd-to-3rd step was usually much higher, often around 80%.
- The drops sit at order 2, then order 3, then at predictable events like prepaid-plan expiries and promo cohorts hitting full price.
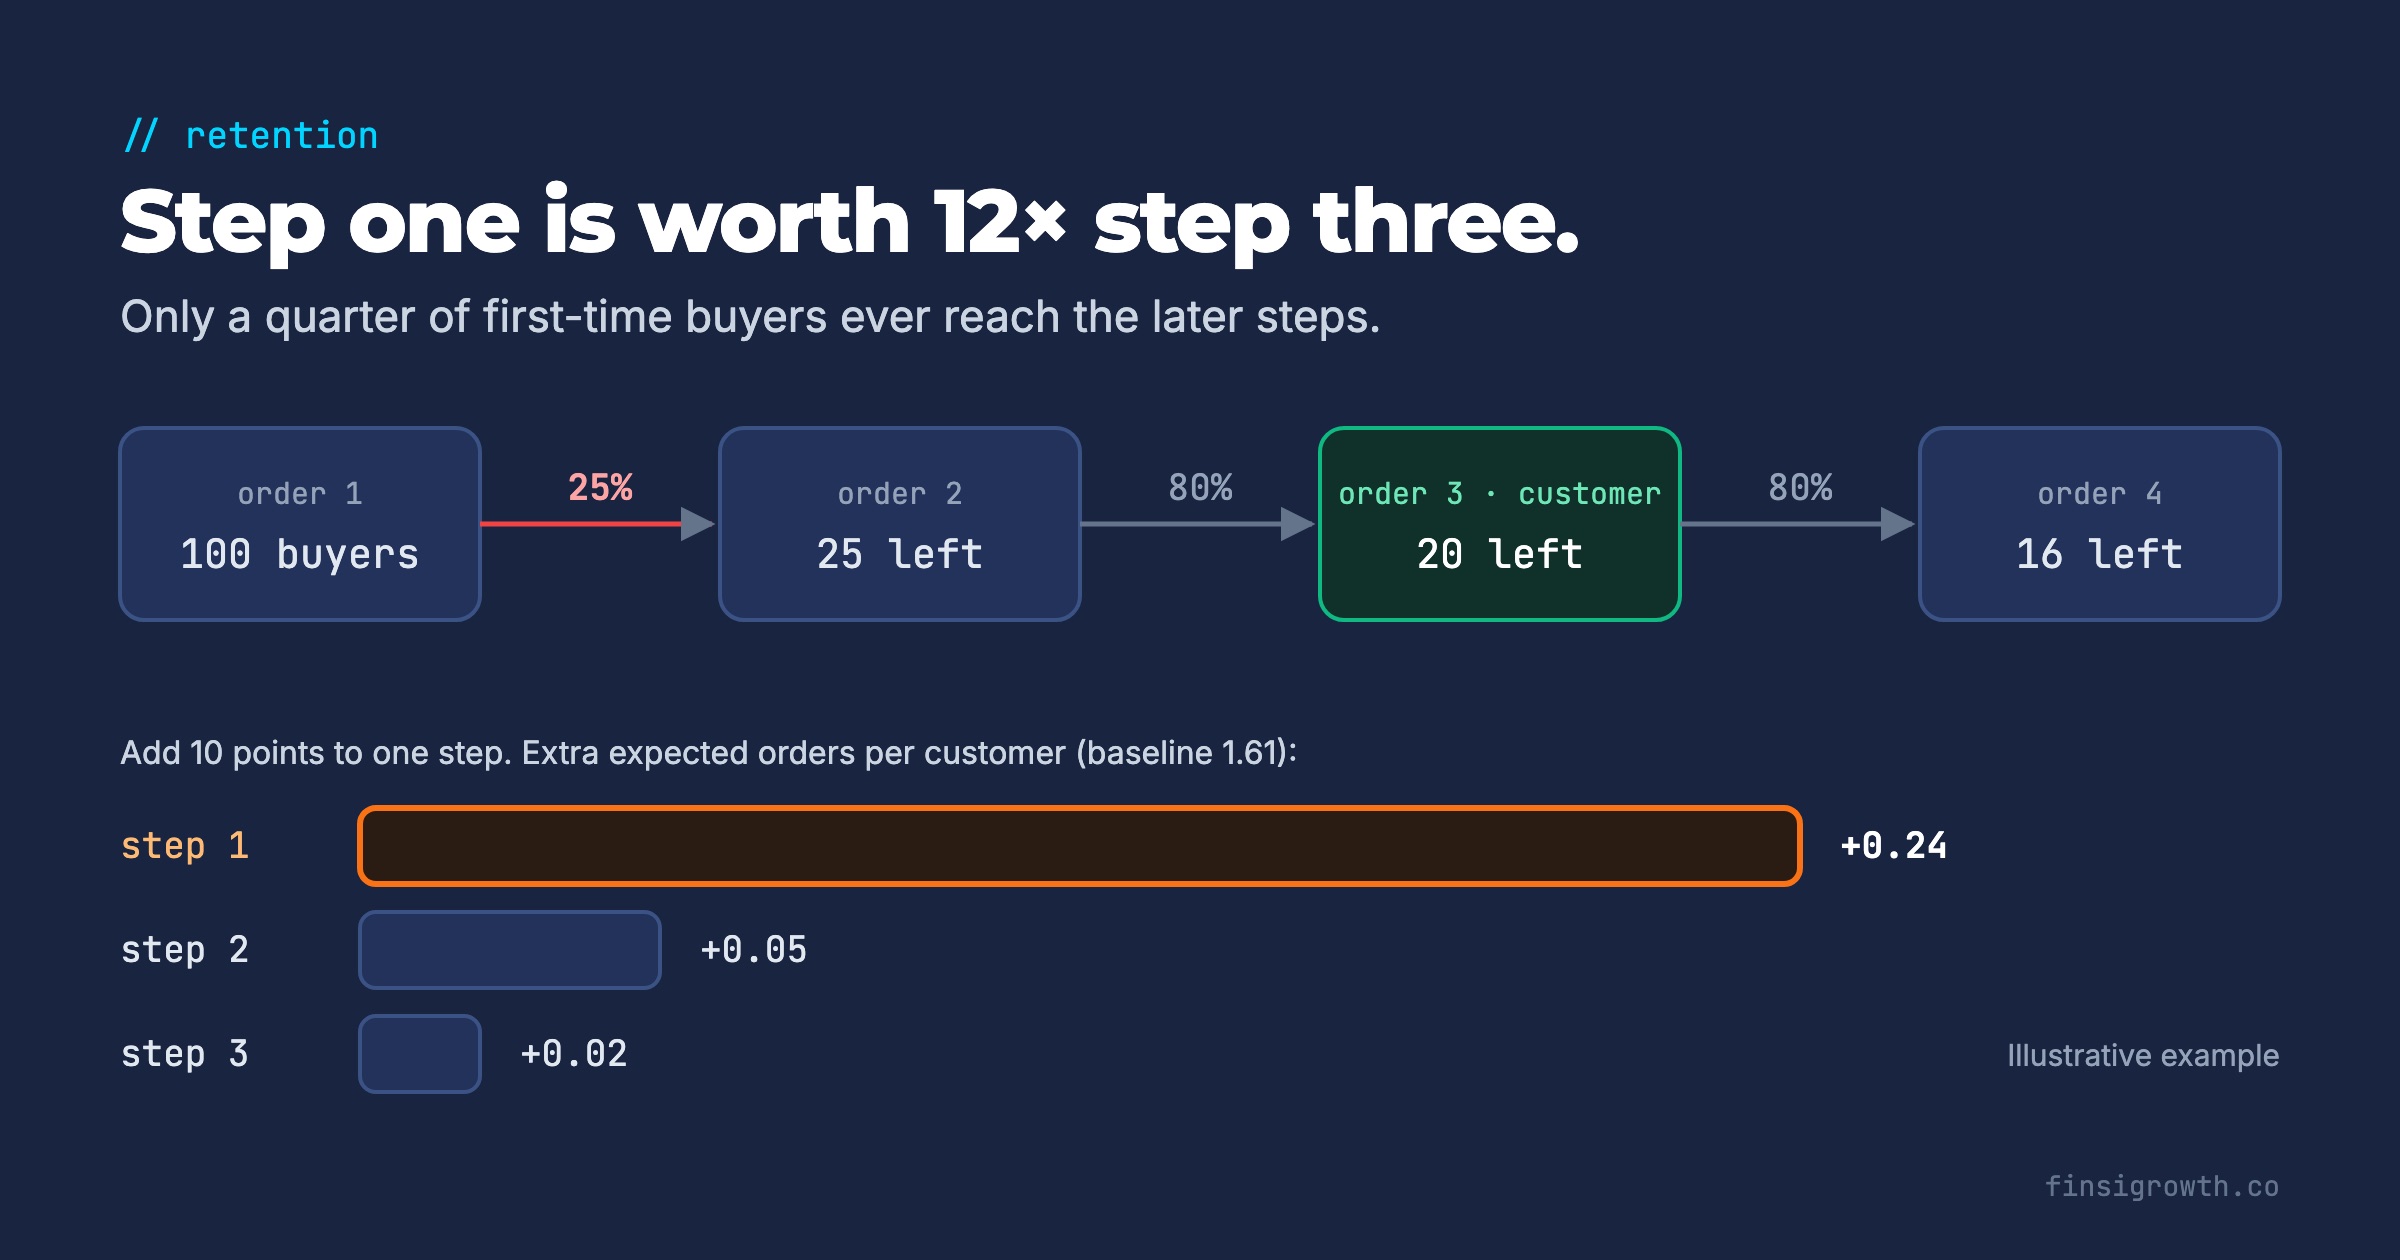
- Raising the first step moves expected orders far more than polishing later ones. In our worked example, +10 points at step one adds about 12× more orders than +10 points at step three.
- Customers who leave after one order, two orders and three-plus orders leave for different reasons, so each step needs its own fix.
What is next-order probability, and why does it beat churn rate?
Next-order probability is a conditional repeat rate: customers with n+1 orders ÷ customers with n orders who have had time to reorder. You calculate it separately for each step: 1→2, 2→3, 3→4 and so on.
A churn rate is an average across everyone you have. That causes three problems:
- It blends tenures. A base full of three-year subscribers and a base full of first-month buyers can show the same monthly churn while having completely different problems.
- It moves with acquisition volume. Spend more on new customers this month and blended churn rises next month, even if nothing about your product or flows got worse. The new people are simply at the riskiest step.
- It doesn’t point anywhere. “Churn is 9%” doesn’t tell you which email, which product or which week to fix. “Only 31% of first-time buyers place a second order” does.
There’s a fourth problem for non-subscription brands: there’s no cancel button, so churn has to be inferred. Next-order probability works the same way whether you sell subscriptions or one-off orders.
On a call last autumn, we put it to a skincare founder this way: if your second-order rate is that low, you don’t have a subscription problem. Forget retention tactics for a moment and fix why people don’t come back. Predicted LTV should be built from these step probabilities, by cohort, channel and offer, not from AOV × an assumed order count.
What do the steps look like across brands?
Here’s what we’ve seen in our client and discovery calls between September 2025 and January 2026. Each figure is the brand’s own number, as reported on the call. Windows and definitions differ, so read these as ranges, not a league table. Client results are specific outcomes, not typical or guaranteed.
| Brand type | 1st → 2nd order | After that | Where it stabilises |
|---|---|---|---|
| Beauty and SPF brand, mostly one-off orders | 25–30% within 90 days | ~80% go from 2nd to 3rd | After order 3 |
| Book-and-drink subscription box | ~70% historically, lower as targeting widened | ~80% at each later step | After order 3 |
| Dog subscription box | ~52% (last 12 months) | ~60% of customers gone by order 3, ~90% by order 9 | Slow decline after order 3 |
| Kids’ supplement brand | 16% of all customers; ~50% of subscribers (target 80%) | Not reported | Not reported |
| Letter-based history subscription | ~20% of monthly subscribers reach order 2 | ”Those who do, stay” | After order 2 |
| Vinyl record club | 80–88% monthly next-order probability | Dips at months 4, 7 and 13 | Never fully; ~20% of a January cohort left at year-end |
Two patterns hold across very different categories. The first step is the weakest, sometimes by a factor of three. And once a customer clears order 3, the steps get much more stable. A head of retention at a two-person team told us in January: “If they go past the third order, they’re pretty sticky.” A longevity-powder founder said the biggest drop was month 1 to 2, then 2 to 3, and that customers were “very sticky” after months 3 to 4.
The wider data agrees. Smile.io tracks more than 1.1 billion shoppers across 250,000 stores. Its network figures put the chance of another order at 27% after one purchase, 49% after two and 62% after three (Smile.io, updated May 2024). Those stores all run loyalty programs, so the typical store may sit lower.
Where exactly do the drops sit?
Plot next-order probability by order number and the weak spots show up as dips. In our calls they cluster in four places.
1. Order 2: the trial didn’t convert. This is the biggest drop everywhere we’ve looked. A deodorant and body-care brand told us order 1 to 2 is the biggest drop “across the industry”. It tested a gift with the first order against a holdout. Its verdict: “still haven’t found something that moves the needle.” An omnichannel beauty brand put its critical repeat window at 60 to 75 days after the first order.
2. Order 3: the habit didn’t form. The second-biggest drop. A supplement subscription brand told us in December that it needs the third order to recover CAC. Their illustration used a $300 CAC against an AOV a little over $100. On revenue alone, that’s three orders before you’re even, and on contribution margin it’s later still. If your payback period runs through order 3, the 2→3 step isn’t a retention detail. It’s whether acquisition pays at all.
3. Contract and plan boundaries. The vinyl club’s monthly next-order probability sat at 80–88%, with dips at months 4, 7 and 13. Those line up with prepaid plans expiring. The same pattern shows up wherever 3-, 6- or 12-month plans end. A flat average churn rate hides it completely.
4. Promo cohorts meeting full price. A dog box ran a $5 first box for a one-day promotion. That cohort renewed at about 40%, against 70–90% for normal cohorts. Discounts don’t just lower the first order’s margin; they lower the next-order probability of everyone acquired with them. We covered how to measure that in discount depth and cohort quality.
A supplement subscription brand gave us a cautionary data point here. With subscription-only checkout, about 50–55% of customers reordered in month 1. After it added a one-time option, it expected subscribers to hit around 80%. They stayed near 50%, and month-1 retention across all customers fell to about 20%. Changing the offer moved the first step without fixing it.
Why the first step is worth the most
Because every later step multiplies off it. Expected orders per customer over the first four orders is:
Expected orders = 1 + p₁ + p₁p₂ + p₁p₂p₃
where p₁ is the 1→2 probability, p₂ the 2→3 probability and p₃ the 3→4 probability.
Here’s an illustrative example using the beauty brand’s shape: p₁ = 25%, then 80% for the next two steps.
| Scenario | p₁ | p₂ | p₃ | Expected orders (first 4) | Change |
|---|---|---|---|---|---|
| Baseline | 25% | 80% | 80% | 1.61 | — |
| Fix step one by 10 points | 35% | 80% | 80% | 1.85 | +0.24 |
| Fix step two by 10 points | 25% | 90% | 80% | 1.66 | +0.05 |
| Fix step three by 10 points | 25% | 80% | 90% | 1.63 | +0.02 |
The same ten points are worth about twelve times more at step one than at step three. That’s not because step three doesn’t matter. It’s because only a quarter of your customers ever reach it. Most retention programs spend their effort on loyalty perks and win-back for customers who are already safe. The money is earlier.
Customers leave each step for different reasons
A beauty operator gave us the clearest version of this on a call in November. Sort churned customers by how many orders they placed:
| Orders placed | Main reason they leave | What can actually help |
|---|---|---|
| 1 | The result didn’t match the expectation | Expectation-setting and usage education before the first order runs out |
| 2 | Product broke, too much product built up, or they found it cheaper elsewhere | Cadence fixes, pack sizes, and a reason to buy direct |
| 3+ | Life events: moved, card expired, forgot | Dunning, address updates, reminders |
The point was that tools can only do so much for one-time buyers, because the problem is the product experience. For second and third orders, flows and offers start to work. That’s another reason to split the metric by step. A single churn rate averages three different problems into one number nobody can act on.
Two things we’ve seen improve the first step without a discount: a product fix, and communication. A longevity-powder founder told us the only change that “massively improved” retention was making the product better. Portal timelines and extra emails didn’t move it. Don’t assume step one is an email problem until you’ve checked what customers actually experienced.
How to calculate next-order probability from Shopify
You need one export and a spreadsheet. No new tools.
- Export orders with customer ID, order date and order status. Drop cancelled and fully refunded orders.
- Number each customer’s orders by date: 1, 2, 3 and so on.
- Set a maturity window W. Pick a window that covers most gaps between orders, such as 90 days for skincare or 45 for a monthly consumable. Our retention metrics guide explains how to pick it from your own data.
- Build the denominator for each step. Customers whose nth order was placed at least W days ago. This matters: customers who bought last week haven’t had time to reorder, and including them drags every step down.
- Build the numerator. Of those, customers who placed order n+1 within W days of order n.
- Divide, then split. Run it by first-order month, first product, acquisition channel and discount code. That’s where the drops become explainable.
If you sell subscriptions, use renewals instead of orders, and check the platform’s numbers against your own. Several operators told us their subscription platform’s counts didn’t match Shopify. We wrote about reconciling platform numbers with Shopify last month.
What to do this week
- Build the step table. Calculate p₁ through p₅ for customers acquired in the last 12 to 18 months, using a fixed maturity window.
- Find your biggest dip. It’ll almost always be p₁. If it isn’t, check for plan expiries or a promo cohort.
- Split p₁ by first product and acquisition offer. If one product or discount code sits 15+ points below the rest, that’s your first fix. It may not be an email fix.
- Run the multiplication. Put your own p₁, p₂ and p₃ into the expected-orders formula. Work out what +5 points at each step is worth in contribution margin.
- Change one weekly KPI. Replace “monthly churn rate” in your retention review with p₁ and p₂ for the latest mature cohort. Keep the list short; we argued for two priorities, not twenty dashboards.
Frequently Asked Questions
Is next-order probability the same as repeat-purchase rate?
The first step is. Repeat-purchase rate is p₁: the share of first-time buyers who place a second order. Next-order probability extends the same logic to every later step, so you can see whether the 2→3 step is where you’re losing people.
How many customers do I need per step?
Enough that a few customers don’t swing the number. As a rough guide, wait until a step has a few hundred customers in its denominator before you act on a change of a couple of points. Combine months into quarters if you’re smaller.
Does this work for brands that don’t sell subscriptions?
Yes, and it’s arguably more useful there. Without a cancel button, churn has to be guessed from silence. Next-order probability only needs order dates.
The first order is a trial
Treat order 1 as an expensive trial, order 2 as proof the product worked, and order 3 as the moment you’ve earned a customer. Measure each step on its own. Then put your effort where the biggest drop is, which is almost always earlier than your current retention program assumes.