Customers you acquire in your off-season are often worth less than customers acquired in peak season, even at the same CAC. One premium tea brand we work with found its summer cohorts retain 30–40% worse than cohorts acquired in colder months. A summer customer bought at the same price is a worse deal.
That doesn’t mean you should stop acquiring in the off-season. It means one yearly CAC target is wrong for half the year. Measure value by acquisition month, then set a separate ceiling for each season. Spend what each month’s cohort can actually pay back.
Key Takeaways
- In one tea brand’s data, summer cohorts retain 30–40% worse than cold-month cohorts. October is its best acquisition month, and January its weakest on 24-month LTV.
- The same brand still raised summer spend, from 0% of peak two years ago to about 20% last year, with a target of 25–30% this year.
- Off-season cohorts look worse for several reasons at once: product fit, offer depth, channel mix and buyer intent. Separate them before you set budgets.
- Track repeat rate at 60, 90 and 180 days, plus 12-month contribution per customer, by first-order month. Compare cohorts at the same age.
- Set a CAC ceiling per season: scale your peak ceiling by how much each month’s cohort is worth.
What is the summer cohort tax?
The summer cohort tax is the gap between what an off-season customer costs and what they’re worth. You pay roughly the same to acquire them, but they come back less often. The difference never shows on your ad dashboard. It shows up months later, in your cohort analysis.
“Summer” is shorthand. The off-season is whenever your category is out of step with how people live:
- Hot drinks slow in summer. The tea brand’s lowest month is June, and iced tea gives more servings per dollar than hot tea.
- Frozen food slows in summer too. One frozen-dumpling brand we work with used to stop ads every June to August. Several other frozen and prepared-meal brands told us the same.
- Meal shakes can slow in winter. A meal-replacement brand saw recurring revenue run about 10–11% below plan in February. A cold winter (“I don’t want shakes for breakfast”), BFCM pull-forward and stockouts all hit at once.
- Supplements peak from January to April and drop off in the second half, according to a sports-nutrition retailer we audited.
Your off-season is specific to your product. Your cohort data will tell you where it sits.
How big is the gap?
In the cleanest data we have, the gap is large. The tea brand compared cohorts by acquisition month on repurchase rate and lifetime value, not on revenue alone. Here’s what it found:
- Summer cohorts retain 30–40% worse than cohorts acquired in cold months.
- October is the best cohort. These customers arrive just before the holiday season. November comes second, and December is still above average.
- January is the weakest when sorted by 24-month LTV.
- Summer cohorts are also smaller, so they barely move a blended average. That’s why the tax goes unnoticed.
The brand also ran its post-purchase survey answers through an analysis split by season. Winter customers reported higher satisfaction and fewer checkout problems. They mentioned word of mouth more often, and their survey answers pointed to more deliberate buying. Summer customers looked more like casual or impulse buyers.
The pattern isn’t unique to one category. A $20M apparel brand told us its Q4-acquired cohorts retain better, which “makes it easier to spend… slightly higher CAC” in Q4. Client results are specific outcomes, not typical or guaranteed.
One note if you read our January ad-spend post. The January point there was about price: auctions are lighter after BFCM, so customers cost less. This post is about value. Both can be true at the same brand, which is exactly why you need value by month next to CAC by month.
Why do off-season cohorts retain worse?
Off-season cohorts retain worse for four reasons, and they usually stack. Before you blame the calendar, check which ones apply to you.
| Driver | What happens | How to check |
|---|---|---|
| Product fit | Customers buy the seasonal variant (iced, light, travel-size), then the season ends | Split cohorts by first product or format |
| Offer depth | Off-season promos pull in discount-driven buyers | Split cohorts by discount code and depth |
| Channel mix | Off-season budgets lean on cheaper, broader audiences | Split cohorts by first-order channel |
| Buyer intent | Peak-season buyers search with purpose; off-season buyers browse | Compare survey answers and organic share by month |
Product fit is the most category-specific. The tea brand’s question to us was whether summer buyers of iced tea even want a hot drink in October. It wants to break cohorts down by packaging type and purchase type. Someone who bought iced tea in July may be a perfectly good customer who just needs a different product in the fall.
Offer depth is often the biggest confounder. In 2024, the tea brand had a big year: heavy ad spend, free shipping on every order and a national TV feature. It brought in “a lot of bodies,” the team said, but “not necessarily financially appropriate bodies.” Without removing that year’s promo effect, you’d blame the months. A dog subscription box client saw the same: “the steeper the discount, the higher the churn.” We covered that mechanism in discount depth and cohort quality.
Channel mix shifts quietly. A gifting-heavy subscription brand we work with told us flatly that it “can’t win on Meta in the off season.” Its 2.0 target ROAS isn’t reachable then. Its down-season budget this March was about $1,500 a month on Meta and $10,000 on Google, against a 2x ROAS floor. Your off-season cohort may mostly be a Google cohort, which is worth knowing before you compare it with a Meta-heavy peak cohort.
Buyer intent is what’s left after the other three. It’s real, but it’s usually smaller than it looks before you control for offer and channel.
Should you stop acquiring in the off-season?
Usually not. Going to zero is the easy reaction, and the tea brand tried it. Two years ago it spent nothing on summer acquisition. Since then it has moved summer spend back up.
Its reasoning is worth copying. A worse cohort is still a positive cohort if you pay the right price for it. And going to zero has costs of its own: subscriber growth stalls, campaigns lose their learning, and the brand starts the fall from a standing start.
There’s also a cash-flow side. The tea brand’s vendor bills come due in summer, exactly when revenue is lowest. That’s a real constraint, but it’s a cash problem, not a cohort problem. Solve it with a budget sized to cash, not by pretending summer customers are worthless.
The frozen-dumpling brand found a middle path. Instead of going dark from June to August, it now uses the off-season to test angles and prepare creative for the fall. Testing at off-season prices, with smaller stakes, makes sense when peak-season tests cost twice as much.
What should you measure by acquisition month?
Build one cohort table where each row is a first-order month and each column is a fixed age. Shopify’s built-in cohort analysis groups customers by the date of their first order and can filter by first-order channel and product (Shopify Help Center, Customers reports). That’s enough to start.
Track these five numbers per acquisition month:
| Metric | Why it matters | Read it at |
|---|---|---|
| Repeat rate at 60, 90 and 180 days | Early signal; doesn’t need a full year of data | Same age for every cohort |
| 12-month contribution per customer | What the cohort is actually worth after COGS, shipping and discounts | 12 months, or a fitted curve |
| Blended CAC that month | Ad spend ÷ new customers, from your own data | Month of acquisition |
| Share acquired on a discount | Separates offer effect from month effect | Month of acquisition |
| First product or format | Shows seasonal-variant buyers who may never buy the core line | Month of acquisition |
Three rules keep the table honest:
- Compare at the same age. A July cohort at 90 days against an October cohort at 90 days. Never this month against last month. Our retention metrics guide explains why.
- Use contribution margin, not revenue. Off-season cohorts often come in on deeper discounts, so revenue overstates them.
- Strip out one-off events. A TV feature, a viral month or a free-shipping year can distort a whole season. Flag those cohorts and read them separately.
Expect acquisition and retention teams to disagree about what the table says. A meal-replacement brand told us that when retention data flags weak acquisition, “it almost becomes a ‘well, that’s your opinion.’” Its acquisition “looked great in January and February,” but the impact showed up later. A shared cohort table settles that argument with numbers.
How do you set off-season budgets?
Set a CAC ceiling per season, scaled by how much that season’s cohort is worth. Here’s the method:
- Start with your peak ceiling. Use the CAC your best months can afford within your payback period. Our break-even CAC guide covers how to calculate it.
- Compute a value index per month. Divide each month’s 12-month contribution per customer by your peak month’s figure.
- Multiply. Off-season ceiling = peak ceiling × value index.
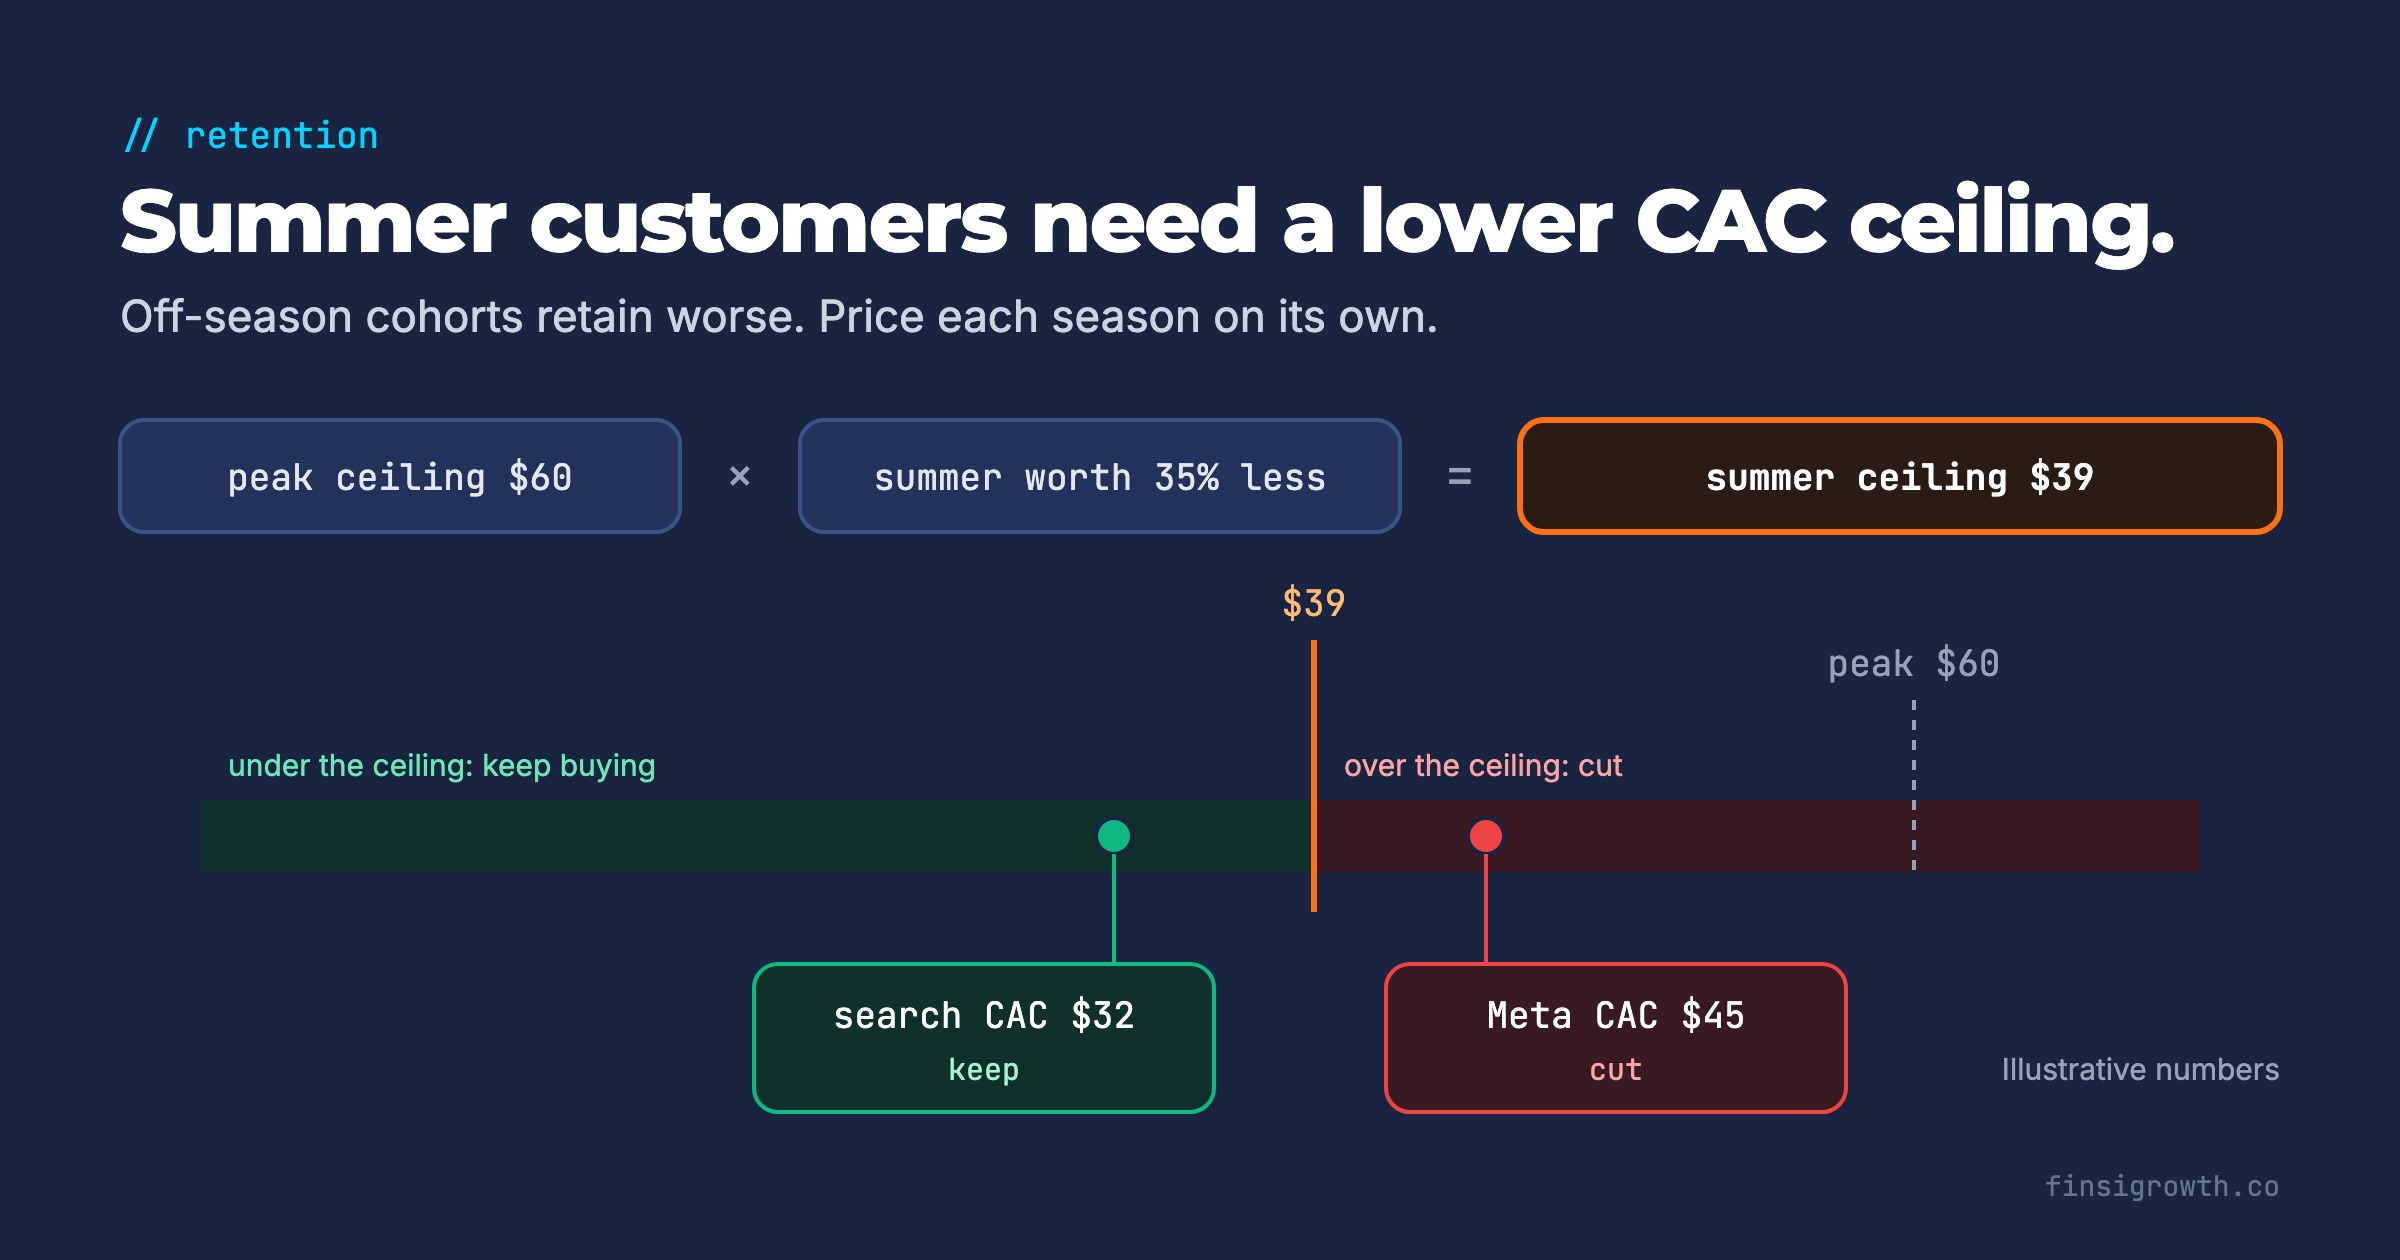
- Spend up to the ceiling, and no further. If off-season CAC comes in under it, keep buying. If it comes in over it, cut.
Here’s a worked example with illustrative numbers. Say your peak ceiling is $60. If summer cohorts are worth 35% less, the middle of the tea brand’s 30–40% range, the summer ceiling is $39. If summer Meta CAC runs at $45, you cut Meta. If summer search CAC runs at $32, you keep it. One ceiling for the year would have overspent on Meta and underspent on search.
Two refinements make this sharper:
- Re-onboard off-season cohorts. Give summer buyers their own post-purchase flow that introduces the core product before the season turns. The tea brand’s question about iced-tea buyers and hot tea is exactly this. Waiting for them to discover it on their own is the expensive option.
- Test less discounting in the off-season. The tea brand sends a 20% sitewide offer every four weeks and wants to test a June without one. Fewer discount-driven buyers in the off-season should shrink the tax at the source.
The goal isn’t zero summer spend or full summer spend. It’s the right LTV:CAC ratio in every month.
What to do this week
- Export first-order month for every customer from Shopify, with first-order discount code, channel and product. That’s your raw cohort table.
- Calculate 90-day repeat rate by acquisition month for the last 24 months. Look for a seasonal pattern across both years, not just one.
- Flag outlier months: PR spikes, free-shipping periods and deep promos. Recompute the pattern without them.
- Compute a value index for each month against your best month, using contribution per customer.
- Set a summer CAC ceiling as peak ceiling × summer value index. Share it with your media buyer before June.
- Build one post-purchase flow for off-season buyers that introduces your core product before your peak season starts.
- Pick one off-season test with no sitewide discount, and compare that month’s cohort against last year’s at 90 days.
Frequently Asked Questions
What is a cohort by acquisition month?
It’s the group of customers whose first order fell in the same calendar month. Tracking each group’s repeat rate and value as it ages shows whether customers acquired in some months are worth more than others.
Should I cut ad spend in my slow season?
Usually not to zero. Off-season cohorts can be worth less, but they’re still profitable if you pay the right price. Set a lower CAC ceiling for the off-season based on cohort value, and spend up to it.
How long do I need to wait to judge a summer cohort?
You can read early signals at 60 and 90 days by comparing repeat rate with other cohorts at the same age. For budget decisions, use 12-month contribution from previous years’ cohorts acquired in the same months.
Price each month on its own.
A customer acquired in July and one acquired in October aren’t the same purchase, even at the same CAC. Measure value by acquisition month, set a ceiling for each season, and keep buying wherever the numbers clear it. The calendar sets the price. Your cohort table tells you whether to pay it.