Search for “financial models every founder should have” and you’ll get a stack of templates built for venture-backed software. SAFE dilution. Stock option calculators. MRR cohorts. DCF valuations. They’re good templates. Most of them don’t fit a brand that buys inventory, ships boxes and pays Meta every few days.
A DTC brand lives and dies on four things: what each order leaves behind, what a customer costs, how fast that cost comes back, and whether there’s cash in the bank while you wait. Eight models cover all four. You can build every one in a spreadsheet, and most from a Shopify export.
Below is each model, what goes into it, a worked example, and the decision it should drive.
Key Takeaways
- Start with the order-level contribution waterfall. Every other model on this list depends on it, and most brands have never built it per SKU.
- Break-even CAC, the cohort payback curve and marginal CAC together tell you how much you can pay for a customer, how long you’ll wait for the money and whether the next budget step is worth it.
- A 13-week cash forecast and an inventory buy plan stop a profitable brand from running out of cash. Stockouts at small brands are usually cash-timing problems.
- Price and discount math is lopsided. At a 50% contribution margin, a 20% discount needs 67% more orders to break even. A 10% price rise can lose about 17% of orders and still come out even.
- Value the brand on adjusted EBITDA times a multiple, then bridge to cash at close. Skip DCF, SAFE dilution and option-pool models unless you’re actually raising venture money.
Which startup finance models don’t fit a DTC brand?
Most founder templates assume recurring software revenue, venture funding and a DCF-style exit. DTC brands usually have none of the three. Here’s how the common startup models translate:
| Startup template | Why it’s a poor fit for most DTC brands | Use this instead |
|---|---|---|
| SaaS financial model (MRR, ARR, net revenue retention) | Orders aren’t recurring unless you run subscriptions, and gross margin is 40–70%, not 80%+ | Order-level contribution waterfall (model 1) |
| SaaS cohort analysis | Tracks recurring revenue, not repeat orders | Cohort payback curve on contribution (model 3) |
| Cash runway model | Assumes steady burn; DTC cash swings with purchase orders and ad spend | 13-week cash forecast (model 4) and inventory buy plan (model 5) |
| CLTV vs CAC | Usually built on revenue LTV | Break-even CAC on contribution (model 2) |
| DCF valuation | Buyers of DTC brands price on earnings multiples | EBITDA × multiple, bridged to cash at close (model 8) |
| SAFE dilution, stock options calculator | Only matters if you raise equity or grant options | Skip until you do |
Keep the SaaS versions if you sell subscriptions. A subscription box has real MRR and real churn. But you still need the contribution and inventory models underneath, because a box has COGS and freight that software doesn’t.
1. The order-level contribution waterfall
The contribution waterfall shows what one order leaves behind after every variable cost. It’s the foundation for every other model here. If this one is wrong, the rest inherit the error.
Build it in three layers:
- CM1 = net revenue − COGS. Net revenue is after discounts, so a 20%-off first order counts as the smaller order it really is.
- CM2 = CM1 − pick, pack and shipping − payment fees − returns allowance.
- CM3 = CM2 − marketing spend allocated to the order.
Here’s an illustrative brand with an $80 first order, the same one we used in the break-even CAC guide:
| Line | Per order | Layer |
|---|---|---|
| Net revenue | $80.00 | |
| COGS (30%) | −$24.00 | CM1: $56.00 (70%) |
| Pick, pack and shipping | −$12.00 | |
| Payment processing (about 3%) | −$2.40 | |
| Returns allowance (2%) | −$1.60 | CM2: $40.00 (50%) |
| Ad spend at a 1.5 new-customer ROAS | −$53.33 | CM3: −$13.33 |
A 70% gross margin looks healthy. A 50% contribution margin before ads is fine. After ads, the first order loses $13.33. That’s not automatically bad, but you need to know it’s happening.
Build it per SKU, not just for the store. Blended margin hides the product that loses money on every ad-driven order. An entry product at 15% COGS and a hero at 45% COGS can’t share one break-even ROAS.
The decision it drives: which products you advertise, and at what ROAS floor. If a SKU’s CM2 can’t cover a realistic CAC, stop leading ads with it.
2. Break-even CAC and the LTV-to-CAC ratio
Break-even CAC is the most you can pay for a new customer before that customer costs you money. You need two versions: first-order and 12-month.
First-order break-even CAC = CM2 of the first order
12-month break-even CAC = first-order CM2 + expected repeat CM2 per new customer within 12 months
In the example, first-order CM2 is $40. If 30% of new customers come back and those repeaters average two more orders, that’s 0.6 repeat orders per new customer. At $30 of contribution per repeat order, that adds $18. The 12-month break-even CAC is $58.
The LTV-to-CAC ratio is the same model expressed as a ratio. Just build it on contribution, not revenue. A $170 12-month revenue figure and a $0 12-month contribution can describe the same customer. We’ve seen exactly that in an audit.
Break-even isn’t a target. Both numbers cover zero overhead. The break-even CAC guide walks through setting a target below them.
The decision it drives: your hard CAC ceiling per channel. Compute actual CAC from Shopify, as paid spend divided by first-time customers, not from the ad platform’s ROAS.
3. The cohort payback curve
A cohort payback curve tracks cumulative contribution per new customer, by acquisition month, against what you paid to acquire them. The month the line crosses CAC is your payback period.
Rows are acquisition months. Columns are months since first order. Each cell is cumulative CM2 per customer in that cohort, divided across every new customer, including the ones who never came back. Shopify’s customer cohort report gives you the repeat counts. Multiply by your repeat-order contribution from model 1.
The second line is why this model has to be split by cohort. A deeper discount lowers first-order contribution and often pulls in customers who repeat less. In our client data, a $5 first-box subscription cohort renewed at about 40%, against 70–90% for normal cohorts. Discount depth and cohort quality covers that pattern.
Compare cohorts at the same age. Month 3 of the January cohort against month 3 of the April cohort tells you something. January’s month 9 against April’s month 3 tells you nothing.
The decision it drives: how long you’re financing each customer, and whether newer cohorts are getting better or worse. If payback is drifting out, find out which offer or channel changed before you add spend.
4. The 13-week cash flow forecast
A 13-week cash forecast is a week-by-week view of cash in and cash out for the next quarter. It’s the DTC version of a runway model. Runway assumes a steady burn. DTC cash swings hard around purchase orders, ad bills and payout timing, so you need weekly resolution.
Set it up with these rows:
| Cash in | Cash out |
|---|---|
| Shopify and other payment payouts (on their actual payout schedule) | Inventory deposits and balances, by PO |
| Marketplace payouts (Amazon, TikTok Shop), on their cycles | Inbound freight, duties and 3PL invoices |
| Wholesale receivables, by expected payment date | Ad platform charges, on their actual billing thresholds or dates |
| Loan or financing draws | Payroll, contractors and software |
| Loan repayments and revenue-based financing sweeps |
Start from today’s bank balance. Roll each week forward. Then add one line most founders skip: a minimum cash floor, the balance you won’t go below. Any week that dips under it is a problem you can see 10 weeks early instead of two days early.
Watch revenue-based financing closely. Its repayment often comes out as a share of daily sales, so a good week of revenue is also a heavy week of repayment. In the valuation guide, we showed how a 13% fee repaid over six months works out to roughly a 50% APR.
The decision it drives: when you can afford the next PO, how much ad spend the quarter can carry and whether you need financing before you need it badly. Update it every week. A forecast you rebuild once a quarter is a report, not a forecast.
5. The inventory buy plan
An inventory buy plan ties each SKU’s sell-through to its lead time and to the cash forecast. It answers what to order, when and how much, given the cash you’ll actually have.
For each SKU, track:
- Weeks of cover = units on hand and inbound ÷ forecast weekly unit sales.
- Restock time = supplier lead time + transit + receiving.
- Reorder week = the week when weeks of cover falls to restock time plus a safety buffer.
- Cash need = deposit and balance amounts on their due dates, fed straight into model 4.
The trap is timing. In our inventory cash-flow example, a $60,000 order with a 13-week lead time and a 50% deposit only turns cash-positive 18 weeks after the deposit. The next deposit is due at week 8. Brands that don’t model this under-order, then stock out, then pause ads, then lose the learning they paid for.
Use forecast bands, not a single number. Plan a low, base and high sell-through case. Order for the base case and line up a fast reorder or air freight option for the high case.
The decision it drives: reorder dates and quantities, and the ad spend cap on any SKU whose weeks of cover are shorter than its restock time. We recheck that cap every three to four days.
6. The spend-response curve and marginal CAC
A spend-response curve shows how many new customers each level of spend buys. Average CAC describes the customers you already bought. Marginal CAC tells you what the next ones cost.
Marginal CAC = (new spend − old spend) ÷ (new customers − old customers)
Build it from your own history. Group weeks by spend level and record new customers from Shopify at each one. Here’s an illustrative curve:
| Weekly spend | New customers | Average CAC | Marginal CAC of the step |
|---|---|---|---|
| $5,000 | 130 | $38.46 | $38.46 |
| $10,000 | 220 | $45.45 | $55.56 |
| $15,000 | 280 | $53.57 | $83.33 |
| $20,000 | 320 | $62.50 | $125.00 |
Against the $58 12-month break-even from model 2, the step to $10,000 a week works. The step to $15,000 doesn’t, even though average CAC there, $53.57, still looks fine. That gap between average and marginal is where scaling losses hide.
Real curves are noisy. Seasonality, creative fatigue and promos all move them, so compare like-for-like weeks. Changes in how Meta’s delivery learns also matter, which is why budget changes need their own math.
The decision it drives: the spend level where the last increment still clears break-even. Raise budgets in steps and judge each step on its marginal CAC, not on the new blended MER.
7. The price and discount model
The price and discount model shows how much volume a price change has to win or can afford to lose. The math is lopsided, and most founders underestimate it.
Using the example’s $80 order and $40 of contribution, and holding per-order costs fixed for simplicity:
| Change | Contribution per order | Orders needed to match today’s profit |
|---|---|---|
| 30% discount | $16 | +150% |
| 20% discount | $24 | +67% |
| 10% discount | $32 | +25% |
| No change | $40 | — |
| 5% price increase | $44 | −9% (you can lose 9% of orders) |
| 10% price increase | $48 | −17% |
| 15% price increase | $52 | −23% |
Orders needed = current contribution ÷ new contribution
A 20% sitewide sale has to drive two-thirds more orders just to stand still. A 10% price increase can lose one order in six and still come out even. And a discount also changes who buys, which shows up later in model 3.
Payment fees scale with price, so the real numbers move slightly. Put your own CM2 in the model rather than borrowing these.
The decision it drives: whether a promotion is worth running and how deep, and whether a price rise is safer than it feels. Run every promo through this table before it goes on the calendar.
8. The valuation and cash-at-close model
A DTC brand is valued as adjusted EBITDA times a multiple, not with a DCF. Under about $1M of earnings, buyers usually price on seller’s discretionary earnings (SDE) instead.
Size sets the starting multiple. In Q2 2026, deals under $500k averaged 2.0× SDE, while deals between $5M and $50M averaged 5.8× EBITDA (IBBA). Quality moves it from there: customer concentration, channel dependence, repeat rate, margin trend and how clean your books are.
Then bridge from enterprise value to the cash you’d actually receive. Debt comes off. Working capital gets trued up. Fees, escrow and earnouts take their share. In our worked example, $9.35M of enterprise value became $5.53M at close before tax. Our DTC valuation calculator runs the full bridge.
You don’t need to be selling to run this model. It tells you which levers are worth working on. One turn of multiple on $2M of EBITDA is $2M of price.
The decision it drives: what to fix in the 12 to 24 months before any sale or raise, and whether expensive financing is costing you more at exit than it’s earning you now.
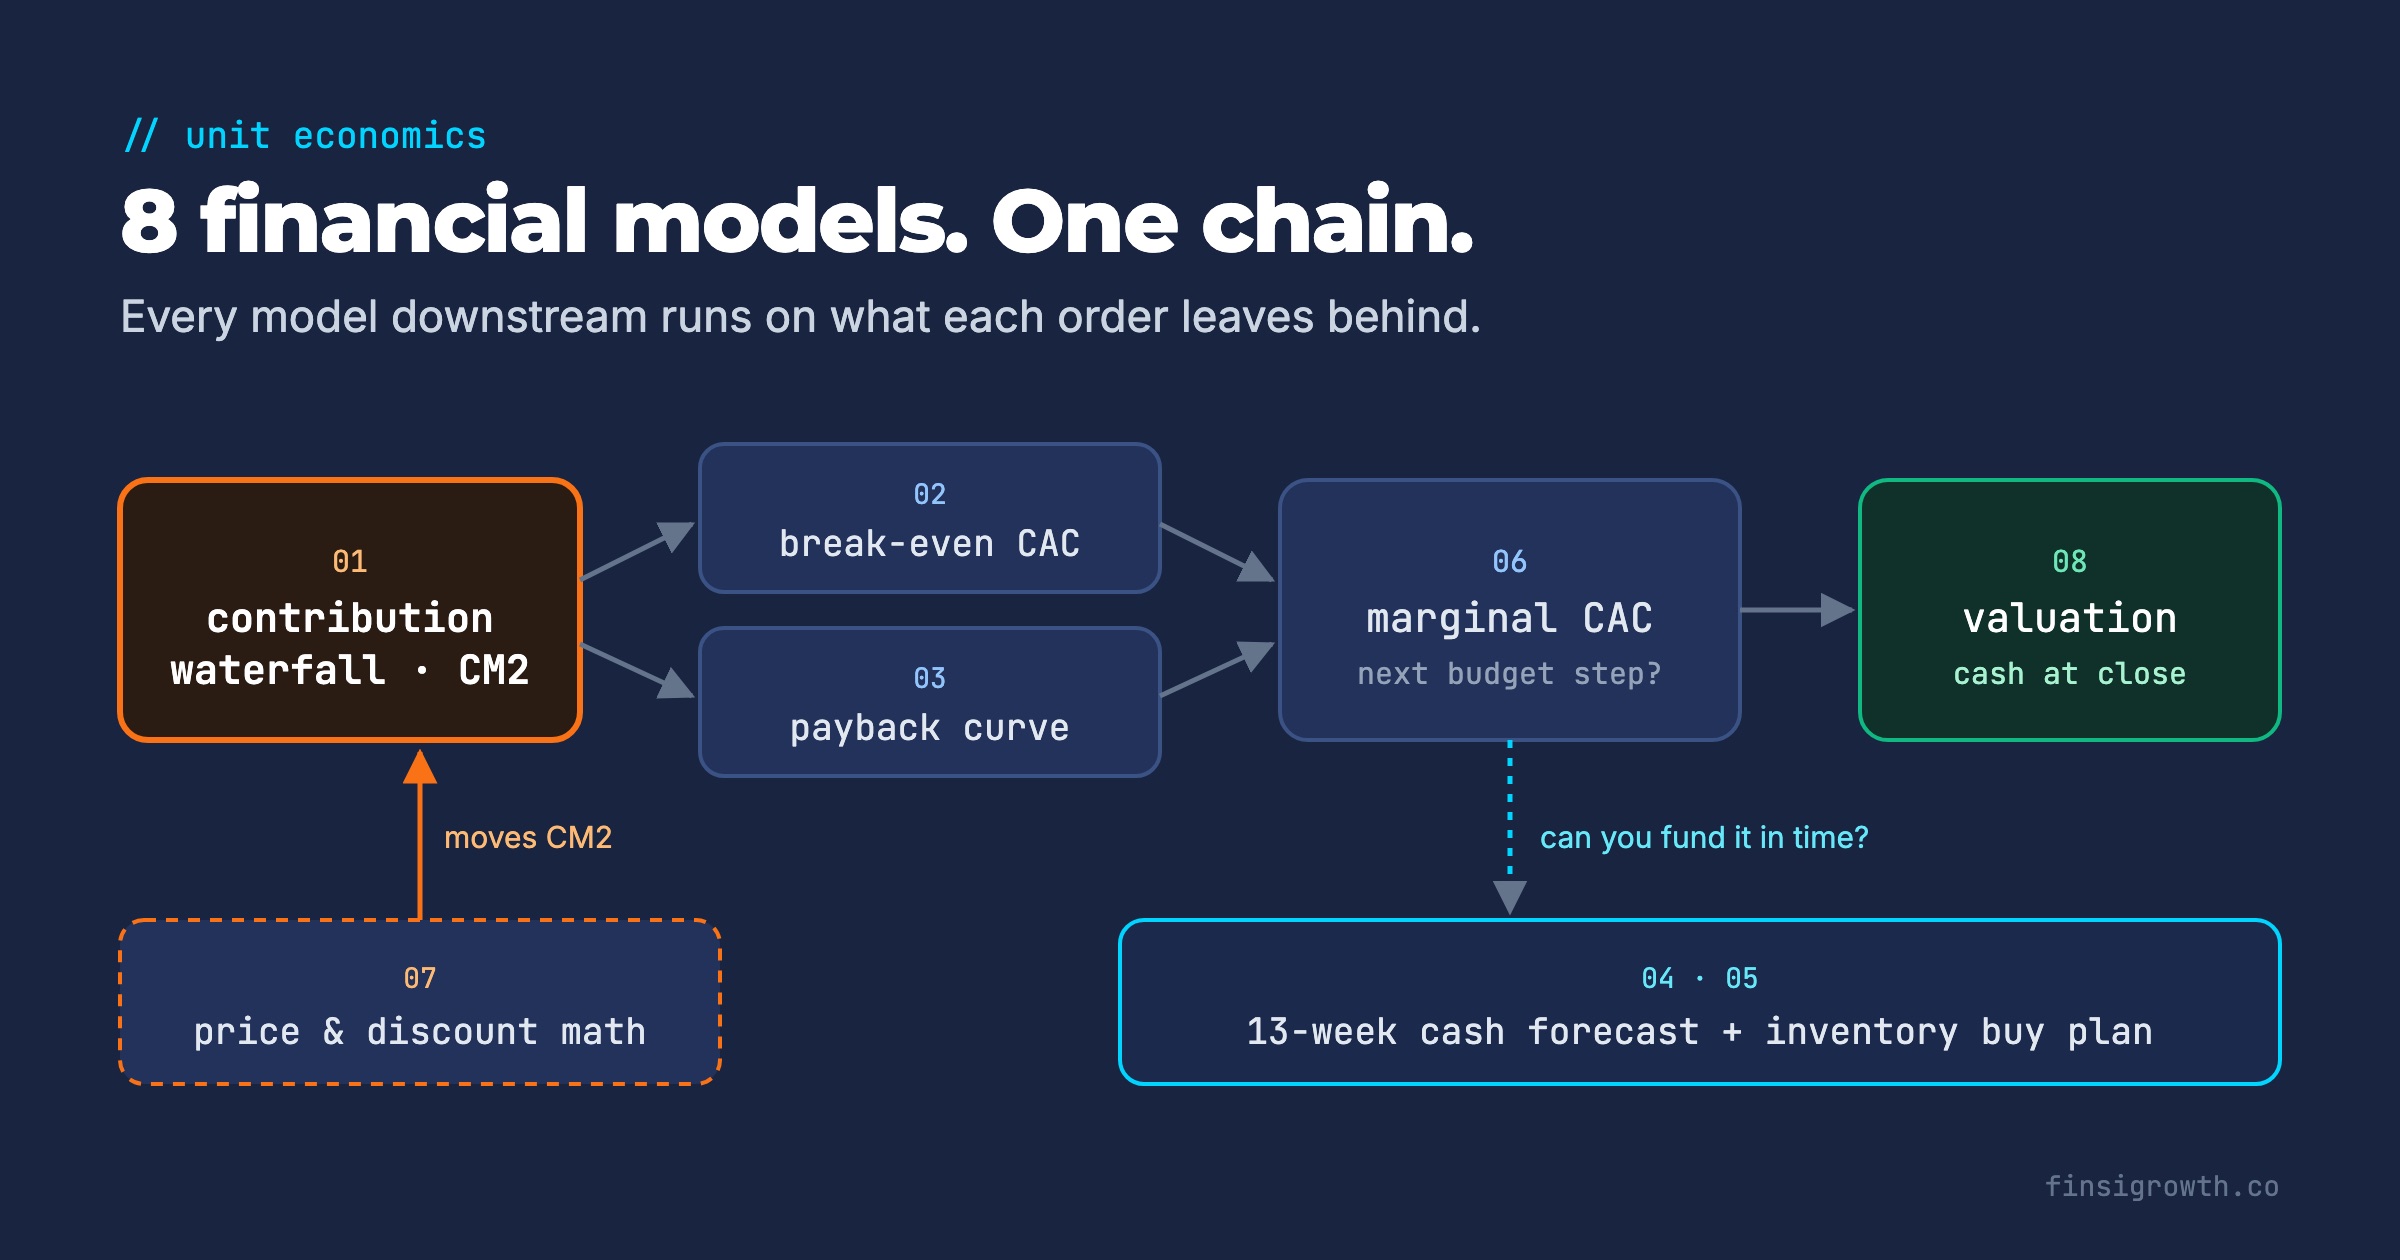
How the eight models connect
None of these models works alone. They feed each other in one chain:
- Contribution waterfall sets CM2 per order and per SKU.
- Break-even CAC and the cohort payback curve turn CM2 into a CAC ceiling and a payback date.
- Marginal CAC tells you which budget steps stay under that ceiling.
- Price and discount math changes CM2, which moves everything above.
- Inventory buy plan and 13-week cash forecast check that you can fund the plan in time.
- Valuation prices the result.
Build them in that order. A cash forecast built on wrong contribution numbers is precise and wrong.
What to do this week
You don’t need all eight by Friday. Here’s the order we’d use:
- Build the contribution waterfall for your top 5 SKUs. Pull 90 days of orders from Shopify with net revenue, COGS, shipping, fees and refunds.
- Compute first-order and 12-month break-even CAC. Use a cohort that’s at least 12 months old for the repeat number.
- Recompute last month’s new-customer CAC from Shopify. Divide paid spend by first-time customers and compare it with both break-even lines.
- Open a 13-week cash sheet. Start with today’s balance, every open PO payment and your ad spend plan. Set a cash floor.
- Run your next promo through the discount table before it goes live.
- Put the outputs on one page. The E-commerce Scaling Scorecard has slots for CM3, nCAC and payback. Add break-even CAC and your lowest forecast cash week next to them.
Frequently Asked Questions
What financial models does a DTC brand need?
A DTC brand needs eight: an order-level contribution waterfall, break-even CAC, a cohort payback curve, a 13-week cash forecast, an inventory buy plan, a spend-response curve for marginal CAC, a price and discount model, and an EBITDA-multiple valuation. Together they cover margin, acquisition cost, payback, cash and value.
Is a SaaS financial model useful for an e-commerce brand?
Only partly. SaaS models track recurring revenue and assume high gross margins with no inventory. An e-commerce brand needs order-level contribution, repeat-order cohorts and an inventory-linked cash forecast instead. Subscription brands can borrow MRR and churn metrics, but still need the inventory and contribution models.
Should LTV be calculated on revenue or profit?
On profit, specifically contribution margin after COGS, shipping, payment fees and returns. Revenue LTV can look healthy while 12-month contribution per customer is close to zero. Use a fixed window, usually 12 months, and average across all new customers, including the ones who never reorder.
How often should a DTC founder update these models?
Update the 13-week cash forecast weekly, and recheck inventory cover against ad spend every few days. Refresh the contribution waterfall and break-even CAC monthly or whenever costs change. Review cohort payback monthly, and revisit the valuation model once or twice a year.
Eight models, one chain
ROAS is a receipt. These eight models are the business. Know what each order leaves behind, what a customer can cost, when the money comes back, and whether the bank account survives the wait. Then make the spend, stock and pricing calls on those numbers.